 8
8peptides
spectra
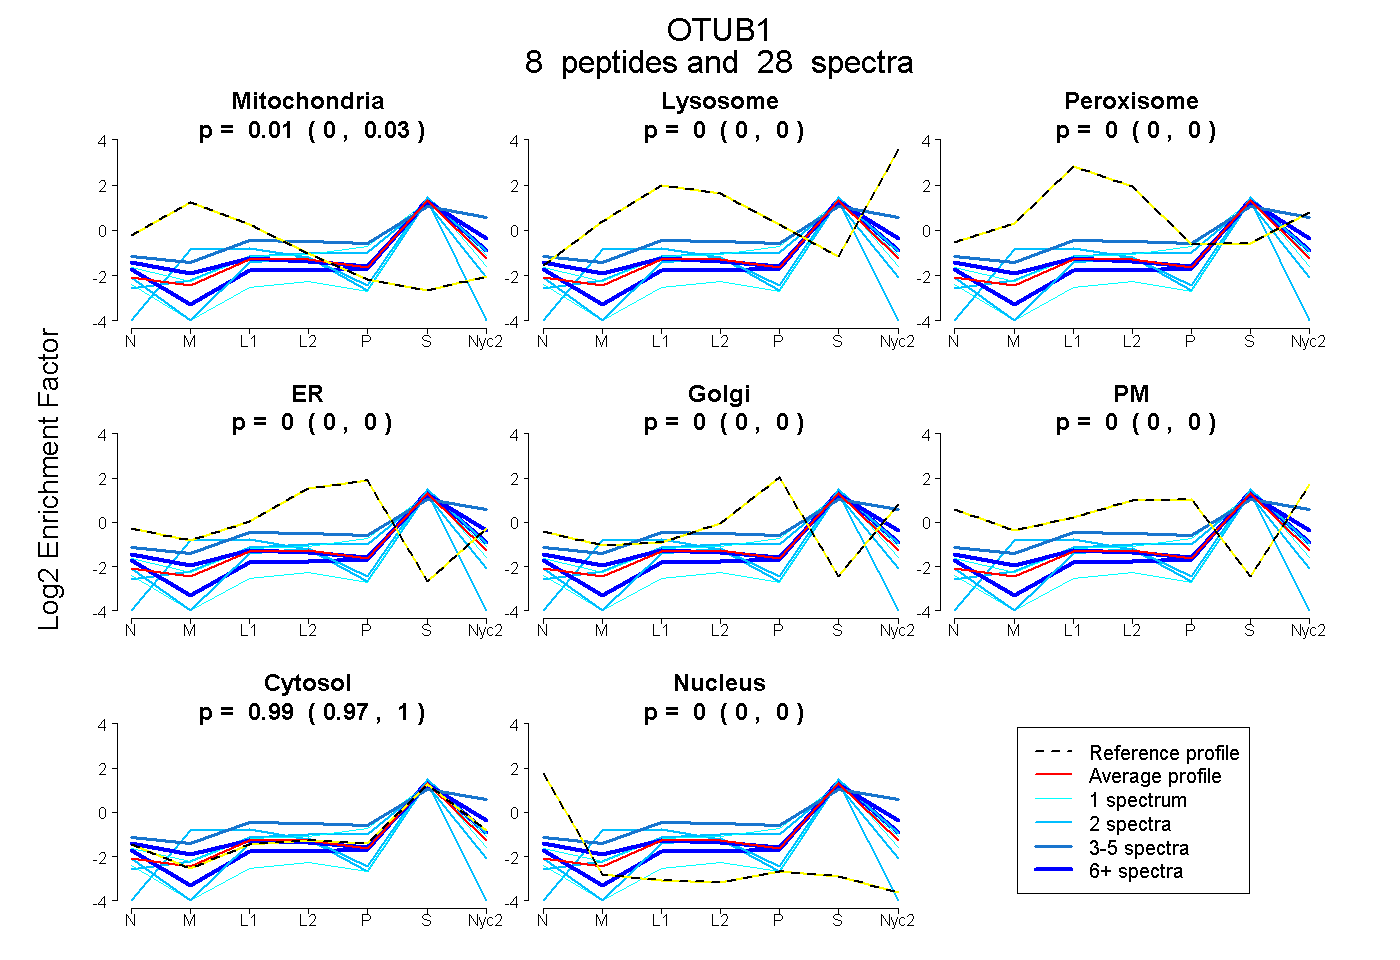
0.000 | 0.026
0.000 | 0.000
0.000 | 0.000
0.000 | 0.000
0.000 | 0.000
0.000 | 0.000
0.971 | 1.000
0.000 | 0.000
6peptides
spectra
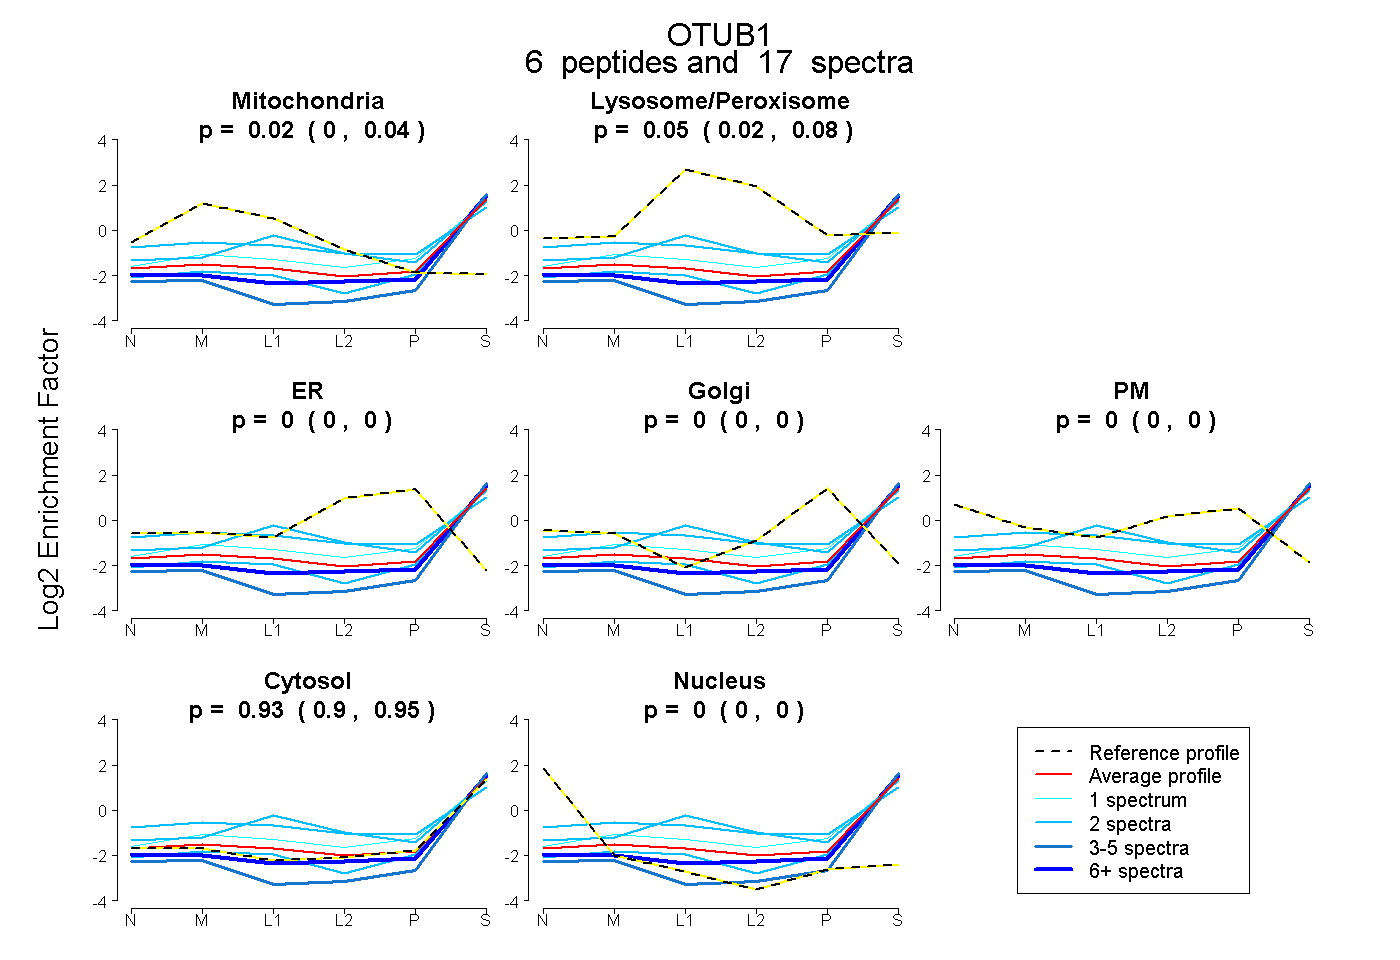
0.000 | 0.040
0.018 | 0.083
0.000 | 0.000
0.000 | 0.000
0.000 | 0.000
0.900 | 0.955
0.000 | 0.000
7peptides
spectra
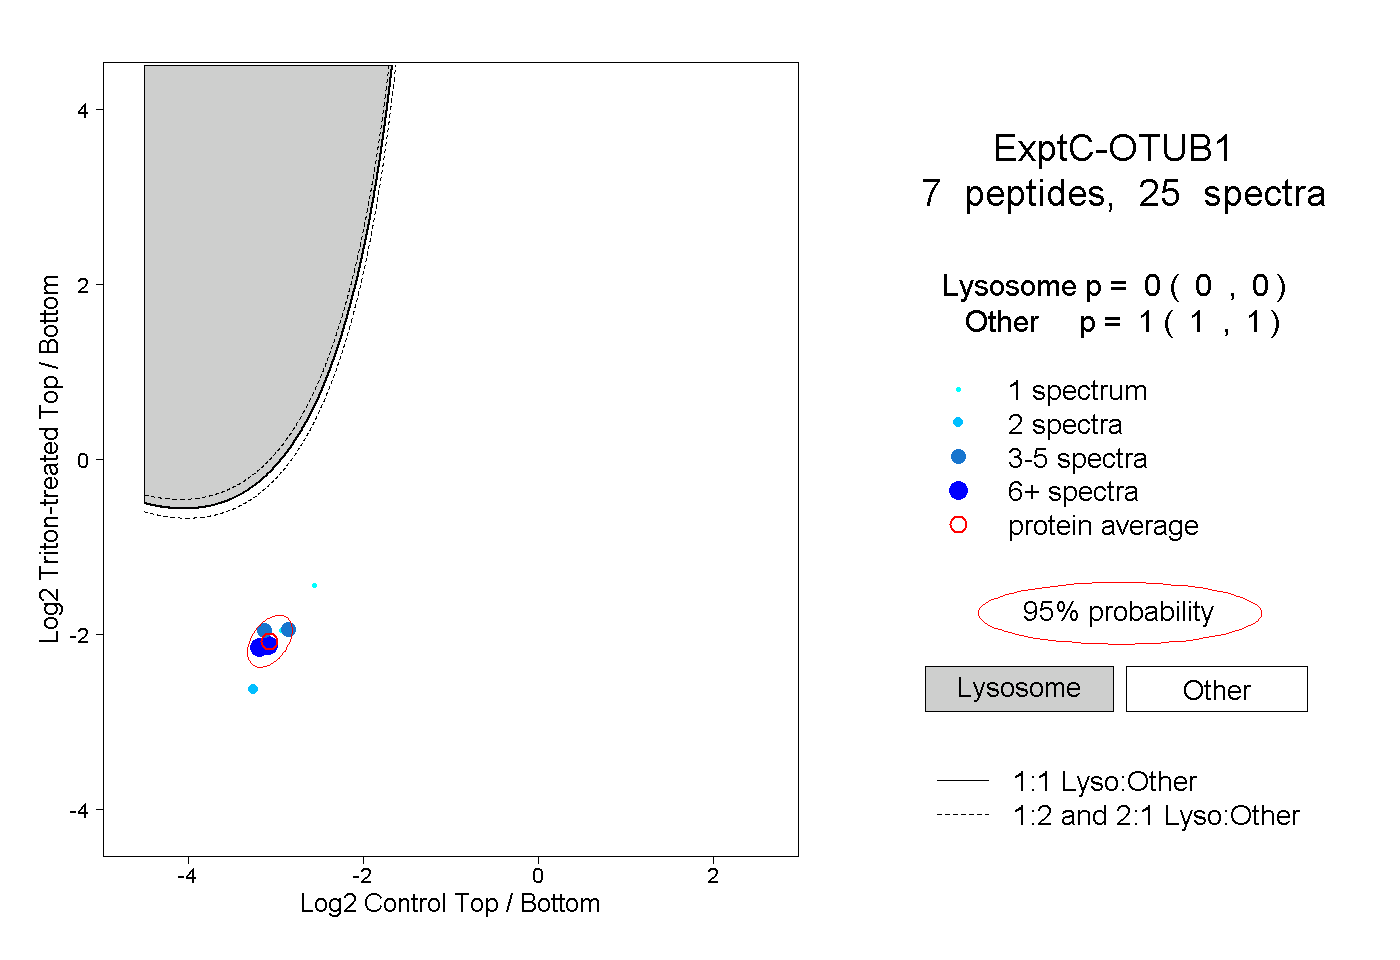
0.000 | 0.000
1.000 | 1.000
1peptide
spectrum
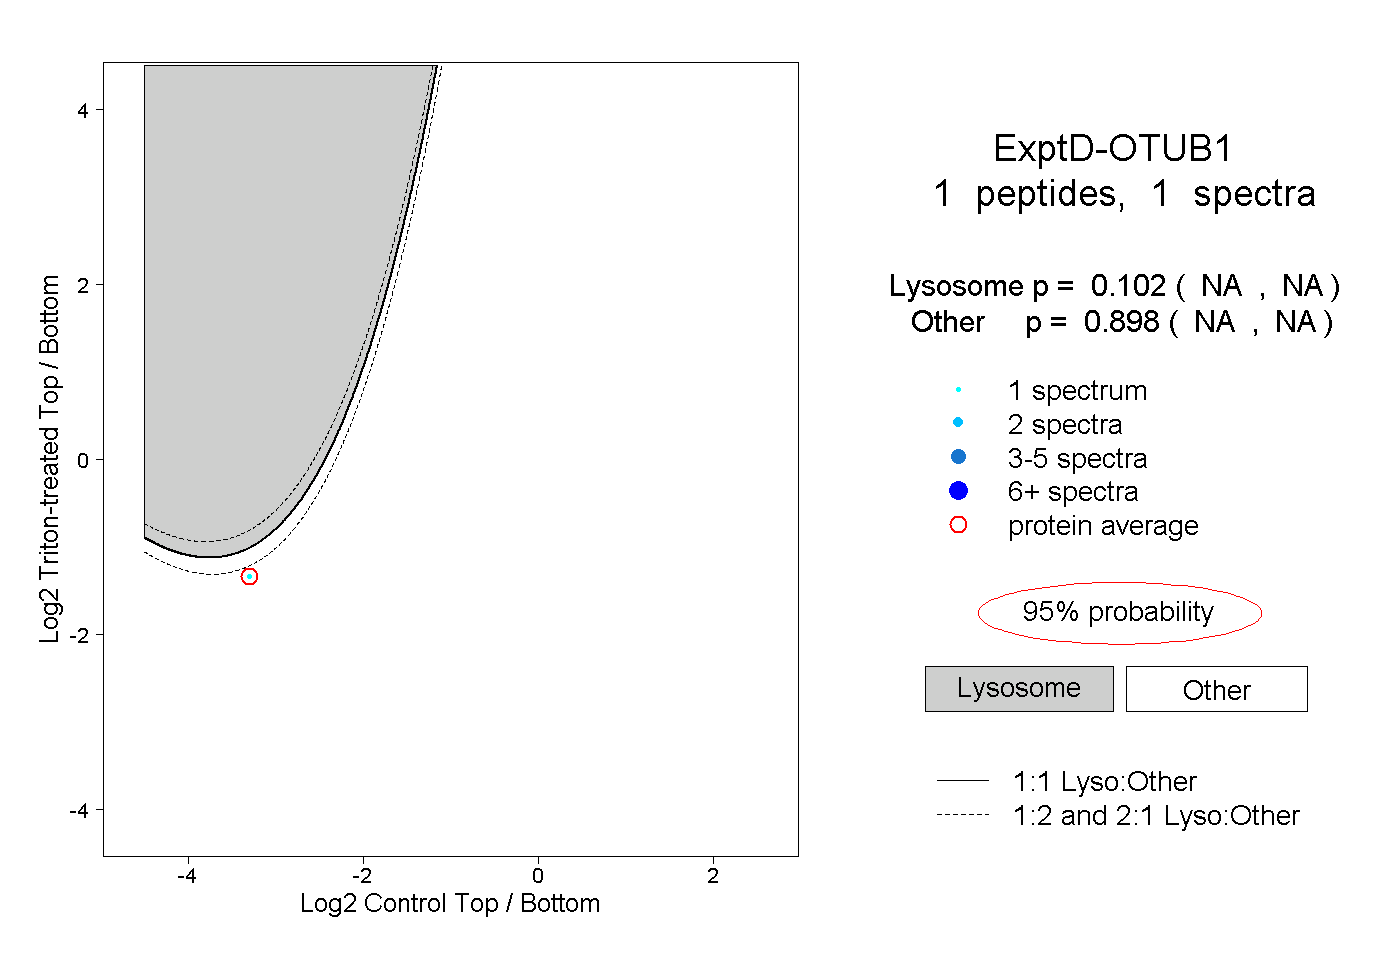
NA | NA
NA | NA