 8
8peptides
spectra
0.000 | 0.026
0.000 | 0.000
0.000 | 0.000
0.000 | 0.000
0.000 | 0.000
0.000 | 0.000
0.971 | 1.000
0.000 | 0.000
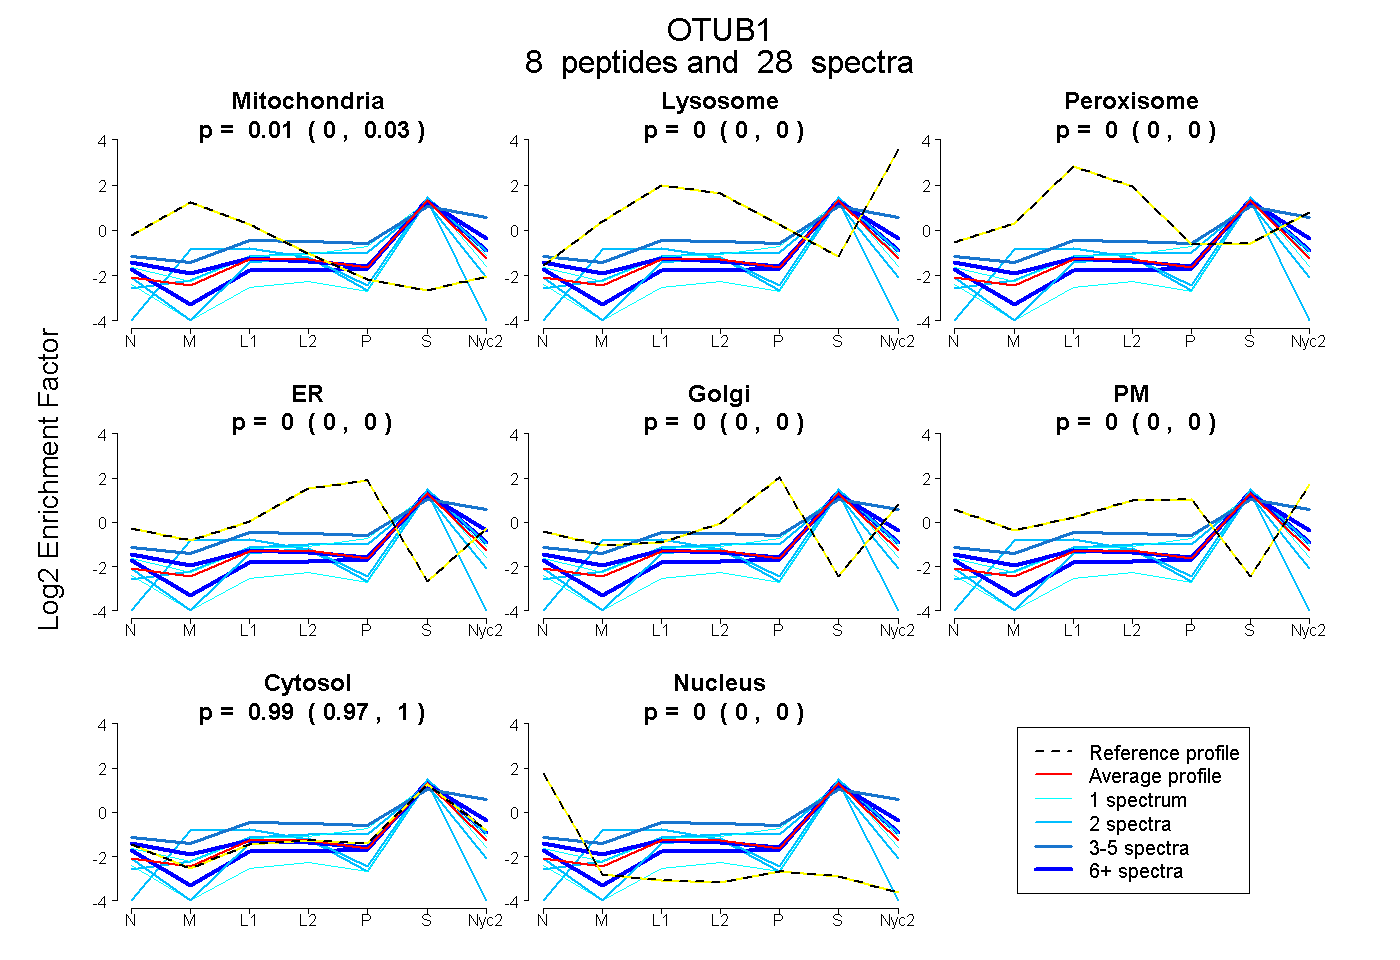
| Plot | Mito | Lyso | Perox | ER | Golgi | PM | Cytosol | Nucleus | |||||
| Expt A |
8 peptides |
28 spectra |
|
0.011 0.000 | 0.026 |
0.000 0.000 | 0.000 |
0.000 0.000 | 0.000 |
0.000 0.000 | 0.000 |
0.000 0.000 | 0.000 |
0.000 0.000 | 0.000 |
0.989 0.971 | 1.000 |
0.000 0.000 | 0.000 |
| 4 spectra, TRPDGNCFYR | 0.000 | 0.298 | 0.000 | 0.000 | 0.000 | 0.002 | 0.700 | 0.000 | ||
| 2 spectra, AFGFSHLEALLDDSK | 0.051 | 0.000 | 0.000 | 0.004 | 0.000 | 0.000 | 0.945 | 0.000 | ||
| 7 spectra, LLTSGYLQR | 0.028 | 0.058 | 0.000 | 0.000 | 0.000 | 0.000 | 0.914 | 0.000 | ||
| 2 spectra, LELSVLYK | 0.000 | 0.000 | 0.000 | 0.000 | 0.000 | 0.000 | 1.000 | 0.000 | ||
| 1 spectrum, GEGGTTNPHVFPEGSEPK | 0.000 | 0.000 | 0.000 | 0.082 | 0.000 | 0.000 | 0.918 | 0.000 | ||
| 1 spectrum, EYAEDDNIYQQK | 0.000 | 0.000 | 0.000 | 0.000 | 0.000 | 0.000 | 0.913 | 0.087 | ||
| 2 spectra, EFCQQEVEPMCK | 0.252 | 0.000 | 0.000 | 0.000 | 0.000 | 0.000 | 0.748 | 0.000 | ||
| 9 spectra, FFEHFIEGGR | 0.000 | 0.000 | 0.000 | 0.000 | 0.000 | 0.000 | 0.982 | 0.018 |
| Plot | Mito | Lyso or Perox | ER | Golgi | PM | Cytosol | Nucleus | ||||||
| Expt B |
6 peptides |
17 spectra |
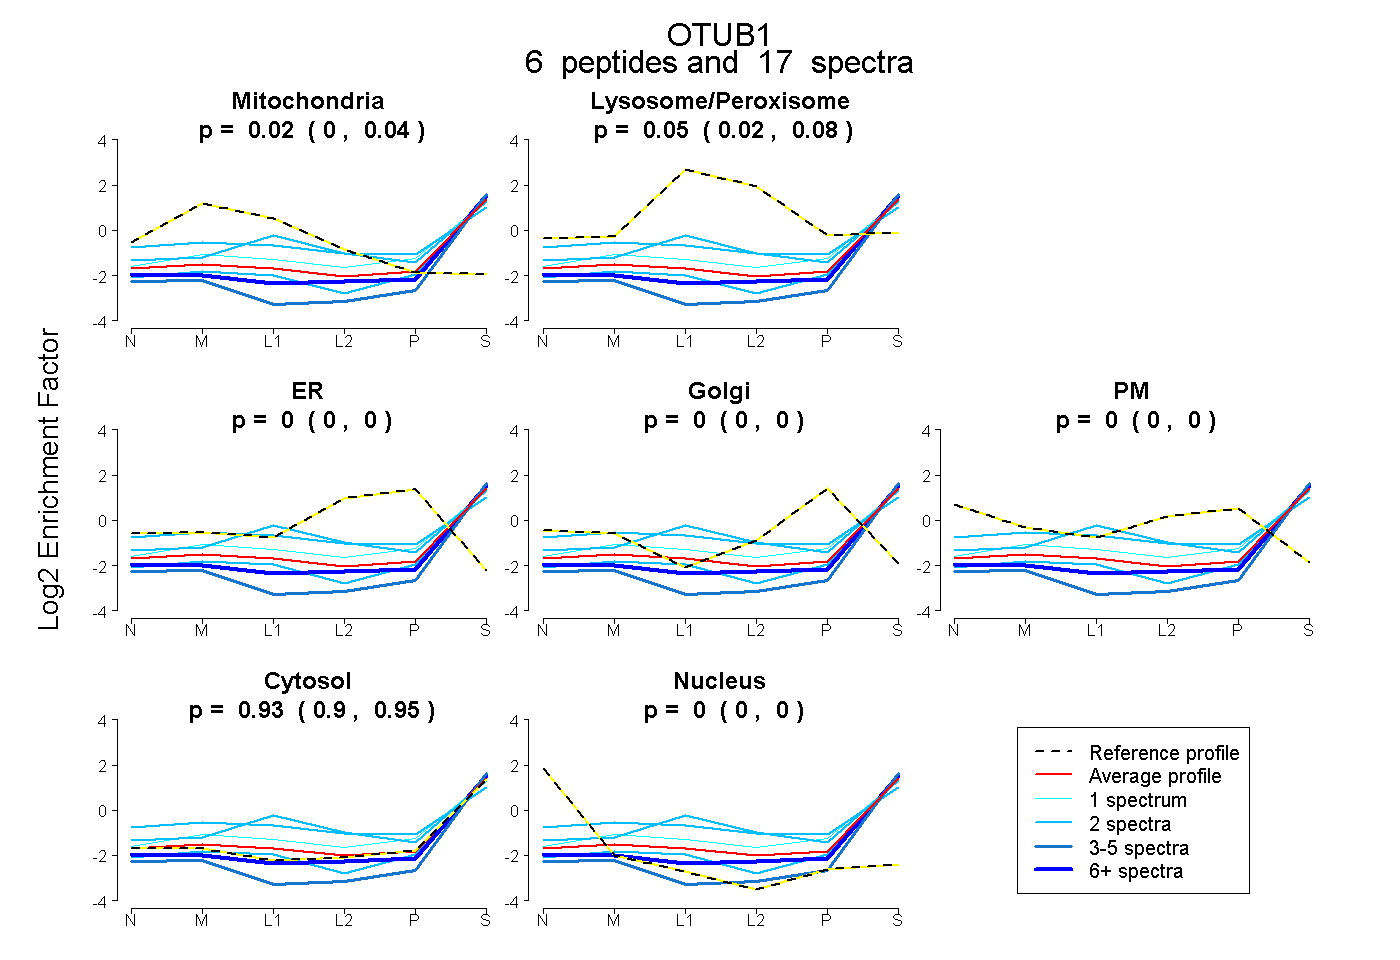 |
0.016 0.000 | 0.040 |
0.053 0.018 | 0.083 |
0.000 0.000 | 0.000 |
0.000 0.000 | 0.000 |
0.000 0.000 | 0.000 |
0.931 0.900 | 0.955 |
0.000 0.000 | 0.000 |
|||
| Plot | Lyso | Other | |||||||||||
| Expt C |
7 peptides |
25 spectra |
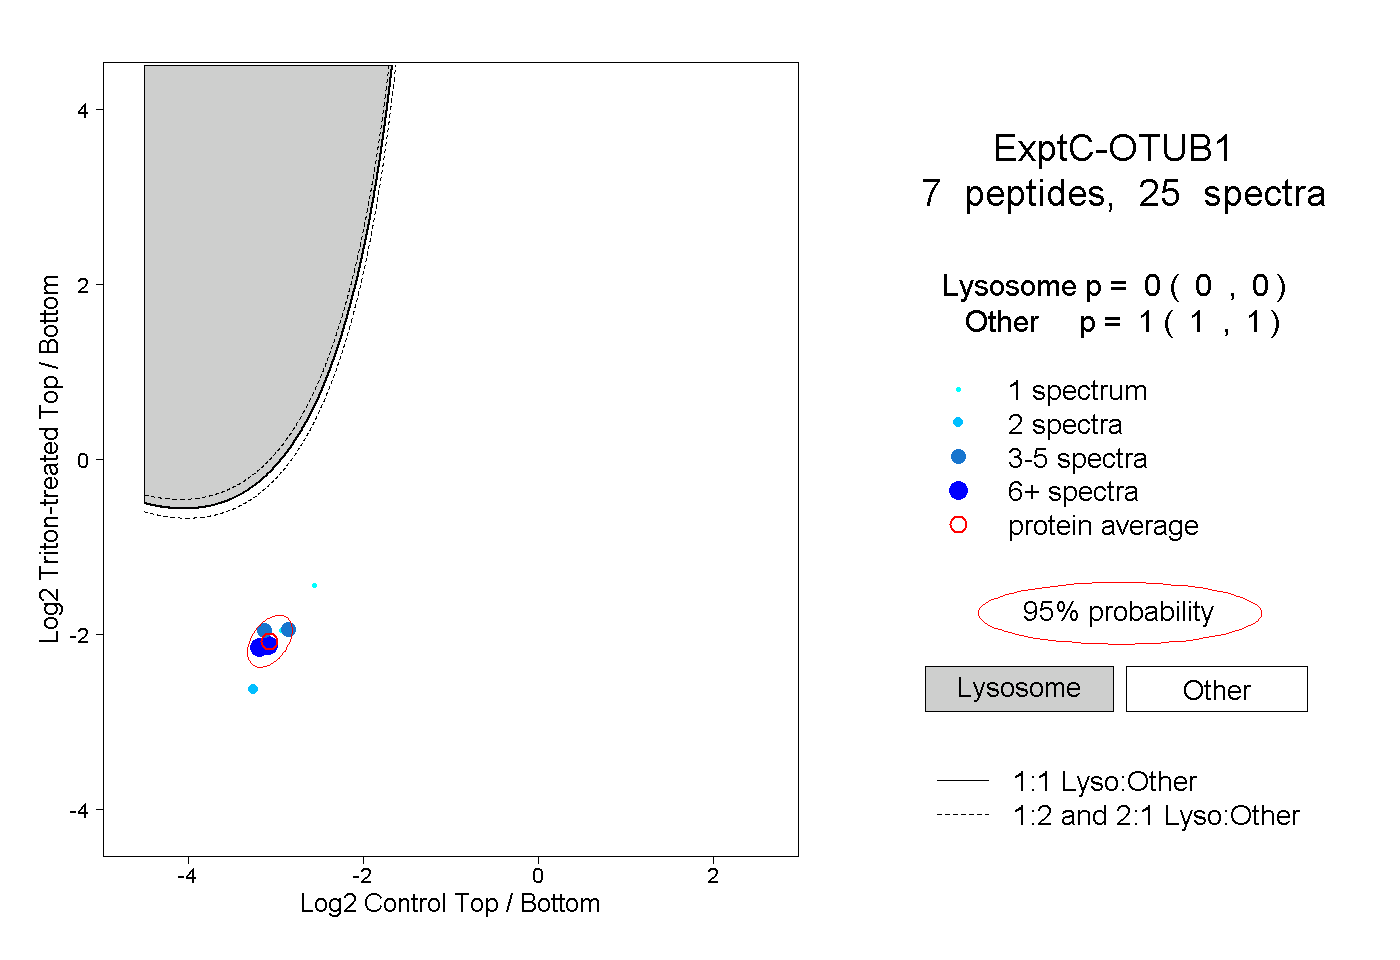 |
0.000 0.000 | 0.000 |
1.000 1.000 | 1.000 |
||||||||
| Plot | Lyso | Other | |||||||||||
| Expt D |
1 peptide |
1 spectrum |
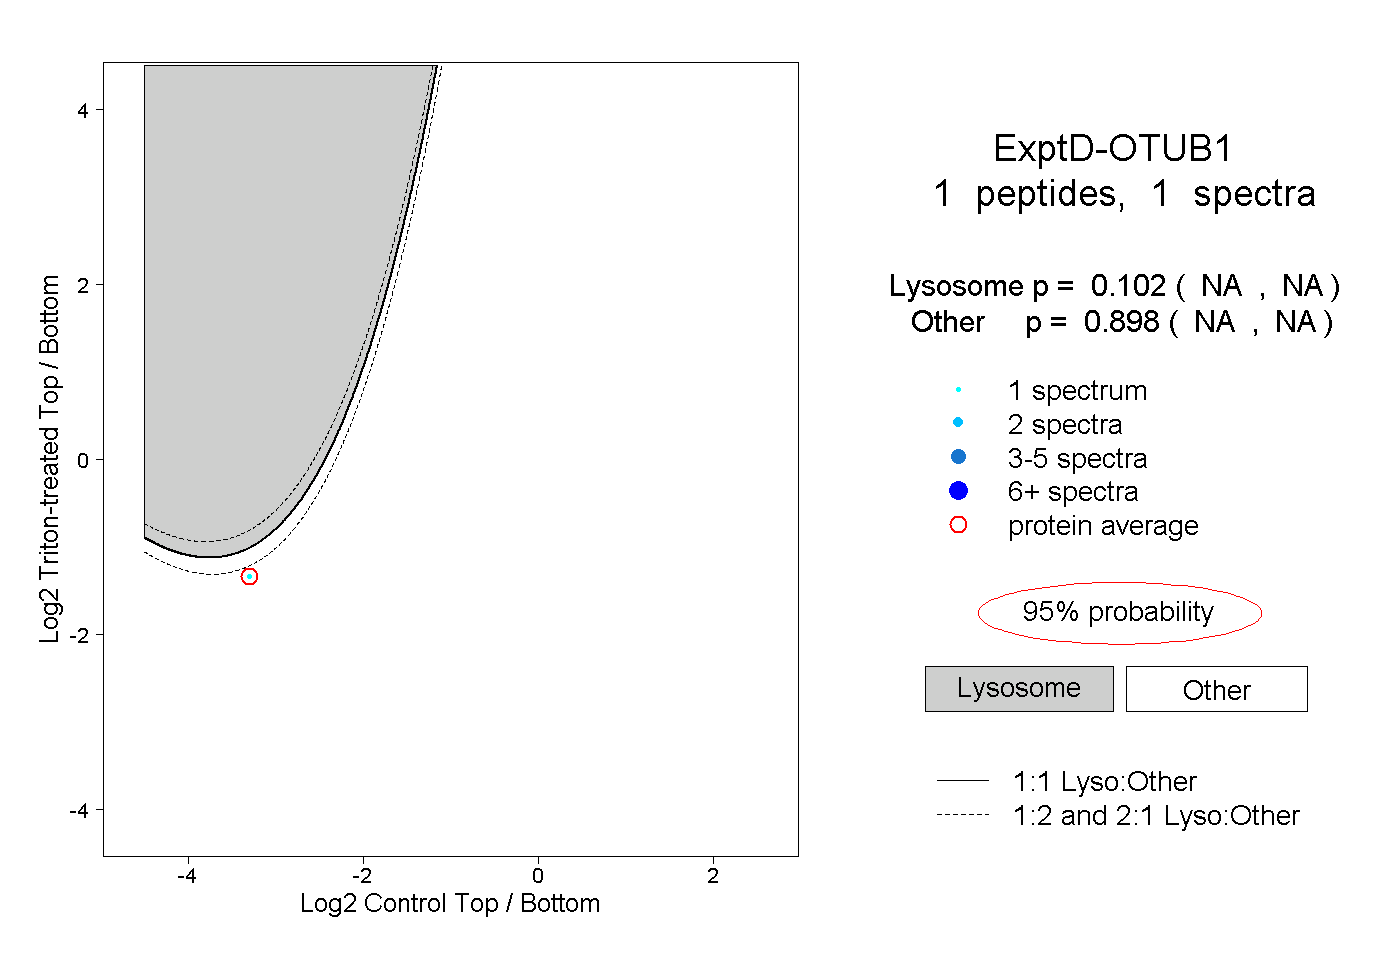 |
0.102 NA | NA |
0.898 NA | NA |