 8
8peptides
spectra
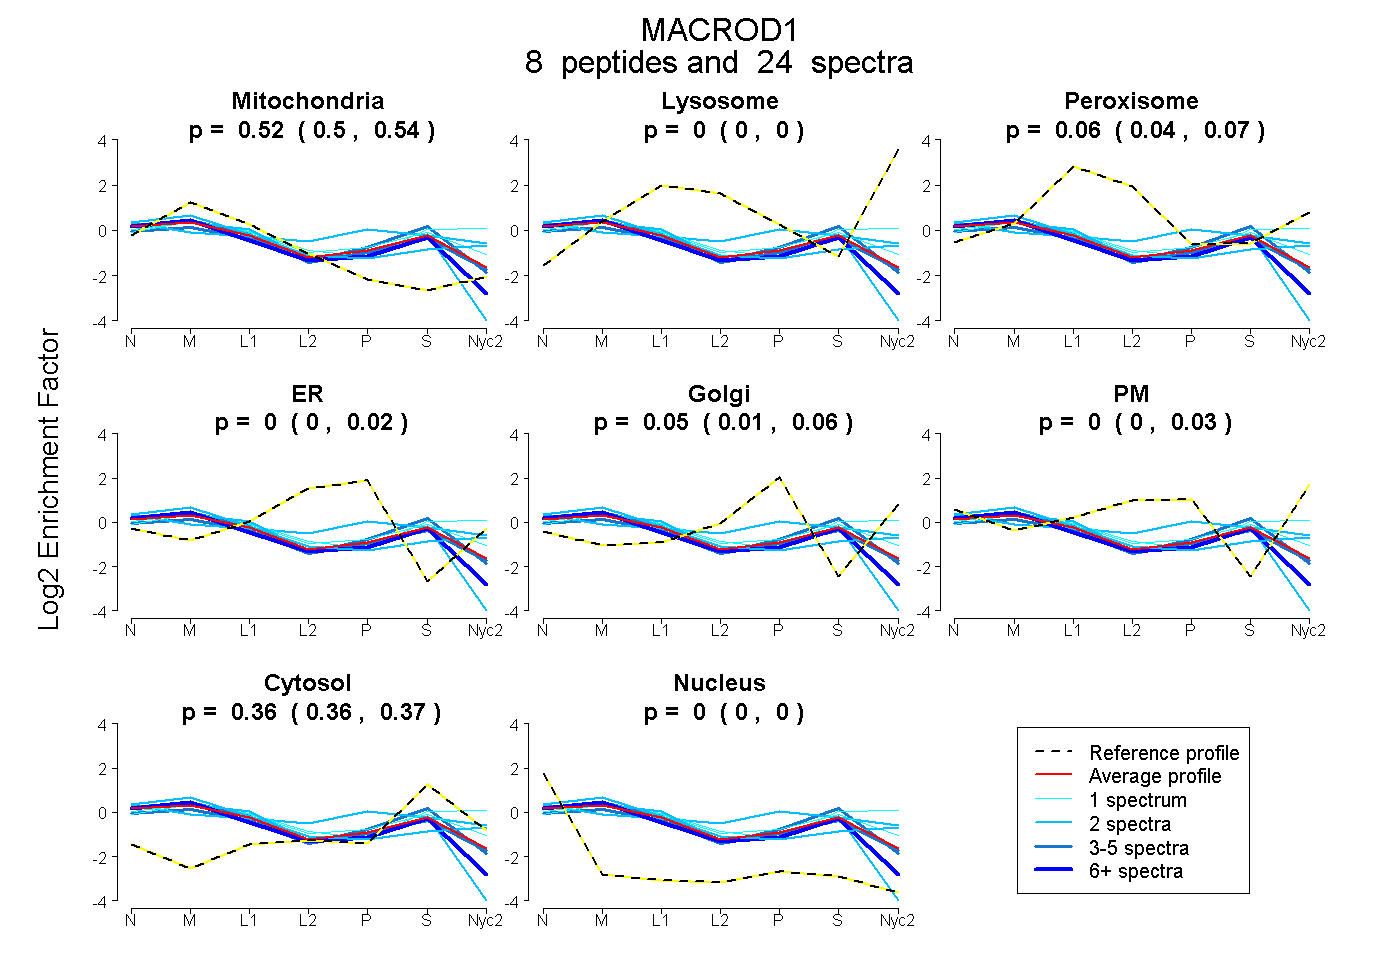
0.499 | 0.538
0.000 | 0.000
0.043 | 0.070
0.000 | 0.021
0.009 | 0.062
0.000 | 0.034
0.357 | 0.374
0.000 | 0.000
6peptides
spectra
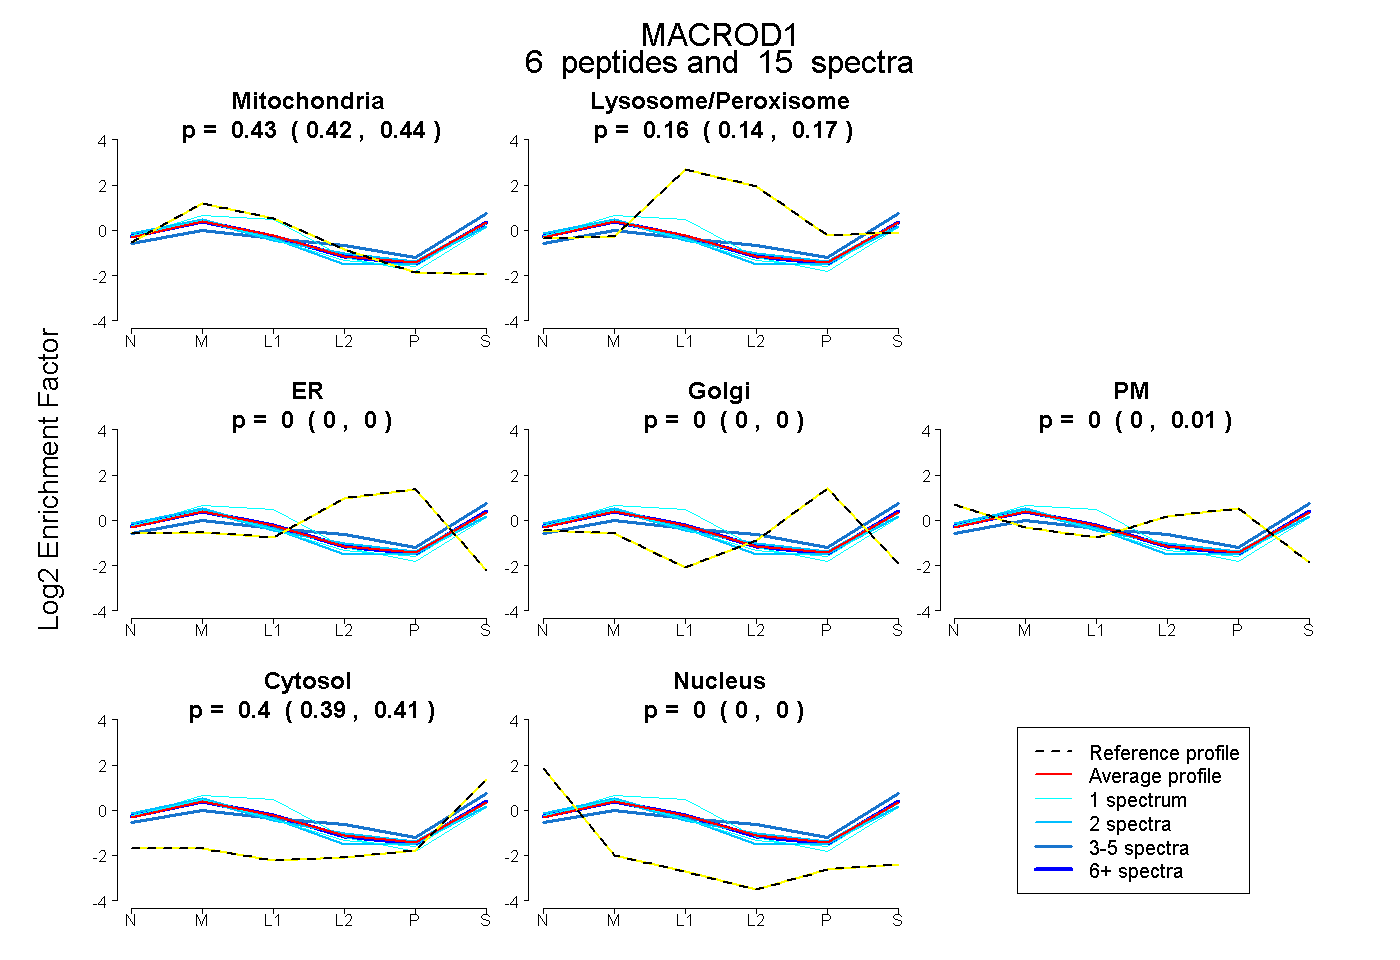
0.419 | 0.444
0.145 | 0.171
0.000 | 0.000
0.000 | 0.000
0.000 | 0.014
0.394 | 0.412
0.000 | 0.002
9peptides
spectra
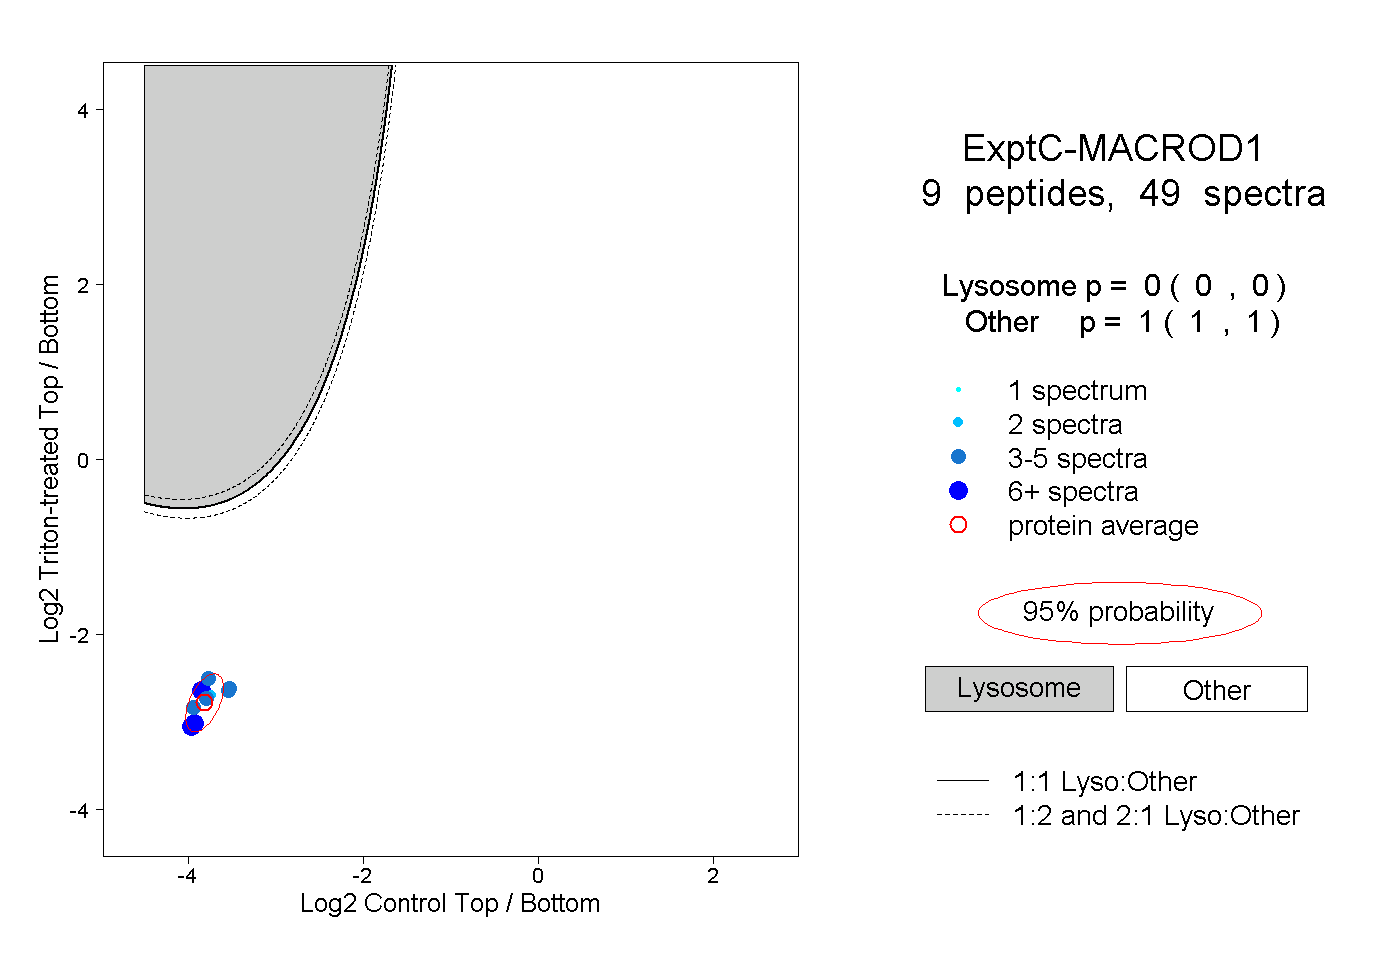
0.000 | 0.000
1.000 | 1.000
3peptides
spectra
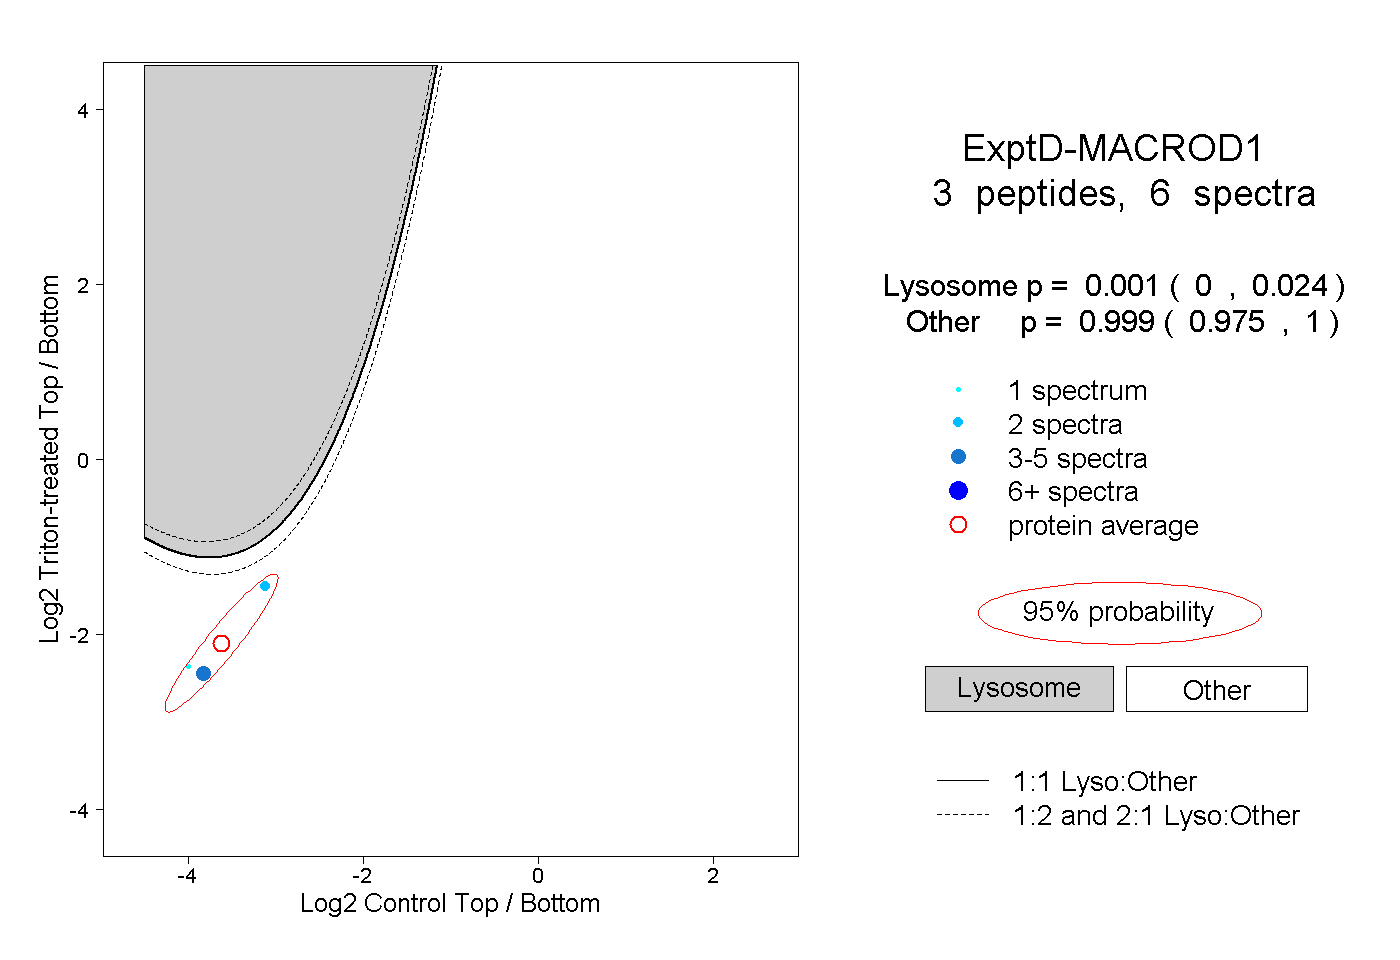
0.000 | 0.024
0.975 | 1.000