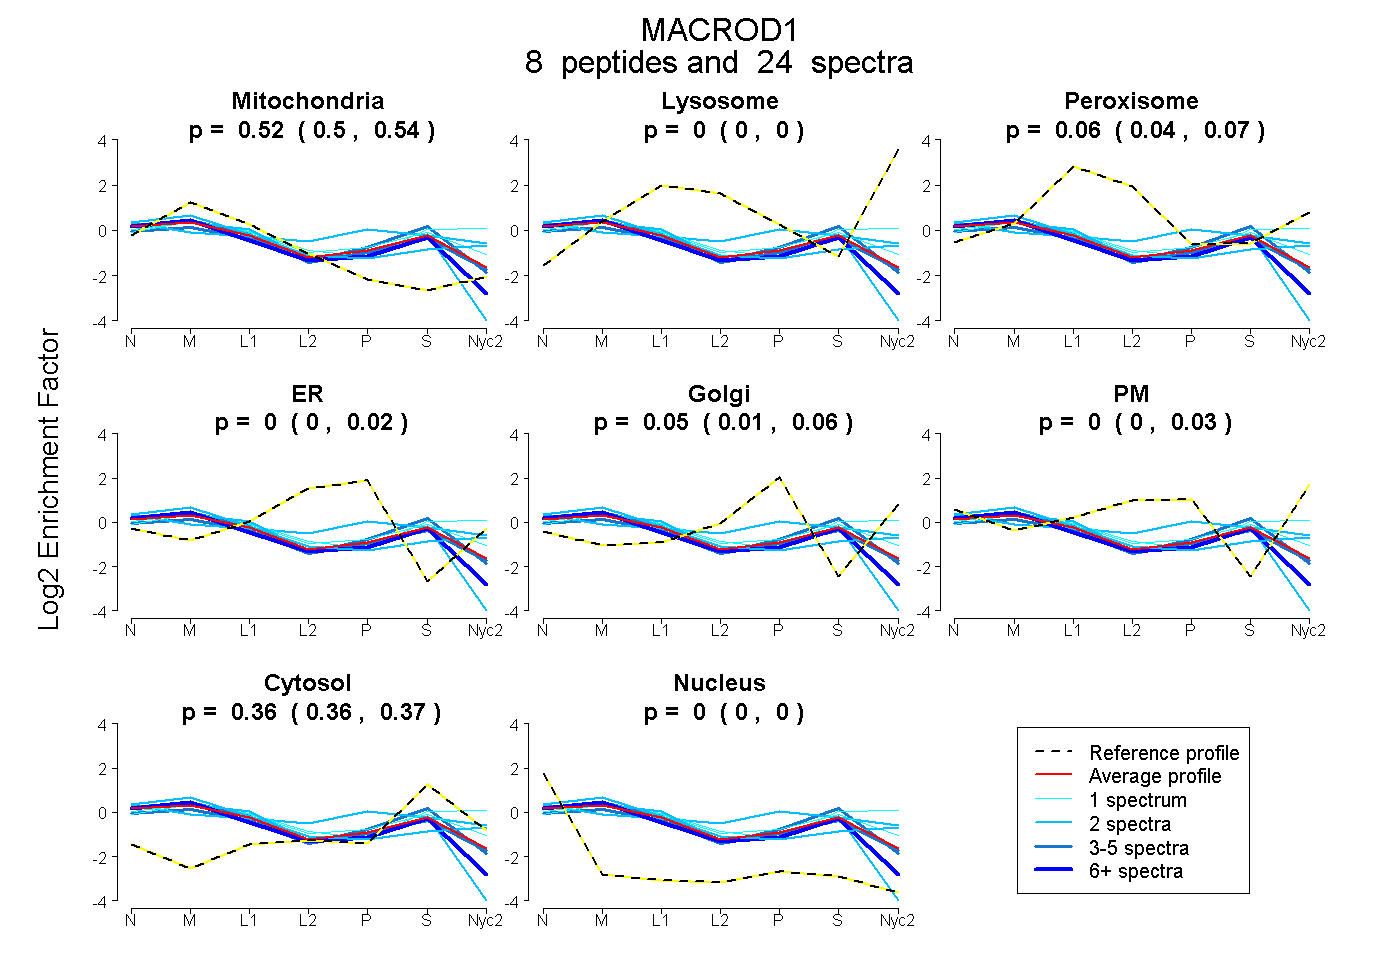
 8
8peptides
spectra
0.499 | 0.538
0.000 | 0.000
0.043 | 0.070
0.000 | 0.021
0.009 | 0.062
0.000 | 0.034
0.357 | 0.374
0.000 | 0.000
| Plot | Mito | Lyso | Perox | ER | Golgi | PM | Cytosol | Nucleus | |||||
| Expt A |
8 peptides |
24 spectra |
|
0.520 0.499 | 0.538 |
0.000 0.000 | 0.000 |
0.063 0.043 | 0.070 |
0.000 0.000 | 0.021 |
0.052 0.009 | 0.062 |
0.000 0.000 | 0.034 |
0.365 0.357 | 0.374 |
0.000 0.000 | 0.000 |
| 7 spectra, TLQNCETGK | 0.613 | 0.000 | 0.000 | 0.000 | 0.000 | 0.000 | 0.337 | 0.050 | ||
| 2 spectra, DEGIYQER | 0.233 | 0.000 | 0.093 | 0.000 | 0.094 | 0.236 | 0.344 | 0.000 | ||
| 4 spectra, AAGSLLTDECR | 0.475 | 0.000 | 0.029 | 0.013 | 0.018 | 0.000 | 0.464 | 0.000 | ||
| 1 spectrum, EEHYFCK | 0.350 | 0.192 | 0.047 | 0.000 | 0.000 | 0.034 | 0.377 | 0.000 | ||
| 2 spectra, SCYLSSLDLLLEHR | 0.634 | 0.000 | 0.000 | 0.000 | 0.000 | 0.000 | 0.277 | 0.088 | ||
| 5 spectra, LPHYFPVA | 0.575 | 0.000 | 0.032 | 0.000 | 0.048 | 0.000 | 0.345 | 0.000 | ||
| 2 spectra, VDLSTSTDWK | 0.536 | 0.000 | 0.021 | 0.000 | 0.000 | 0.193 | 0.250 | 0.000 | ||
| 1 spectrum, LEVDAIVNAANNSLLGGGGVDGCIHR | 0.409 | 0.000 | 0.128 | 0.000 | 0.022 | 0.078 | 0.364 | 0.000 |
| Plot | Mito | Lyso or Perox | ER | Golgi | PM | Cytosol | Nucleus | ||||||
| Expt B |
6 peptides |
15 spectra |
 |
0.435 0.419 | 0.444 |
0.160 0.145 | 0.171 |
0.000 0.000 | 0.000 |
0.000 0.000 | 0.000 |
0.001 0.000 | 0.014 |
0.404 0.394 | 0.412 |
0.000 0.000 | 0.002 |
|||
| Plot | Lyso | Other | |||||||||||
| Expt C |
9 peptides |
49 spectra |
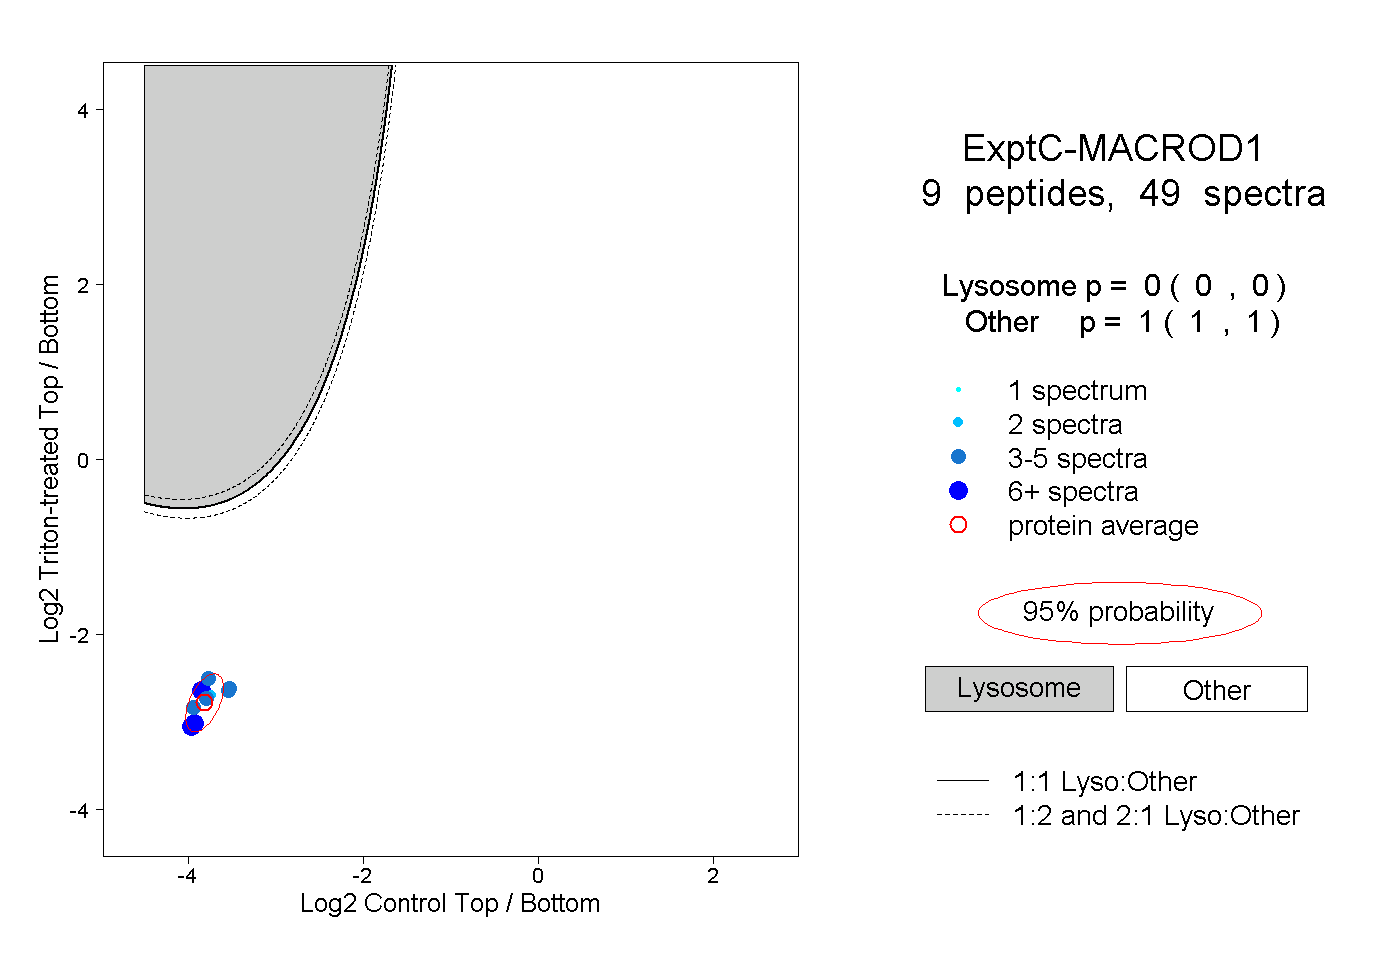 |
0.000 0.000 | 0.000 |
1.000 1.000 | 1.000 |
||||||||
| Plot | Lyso | Other | |||||||||||
| Expt D |
3 peptides |
6 spectra |
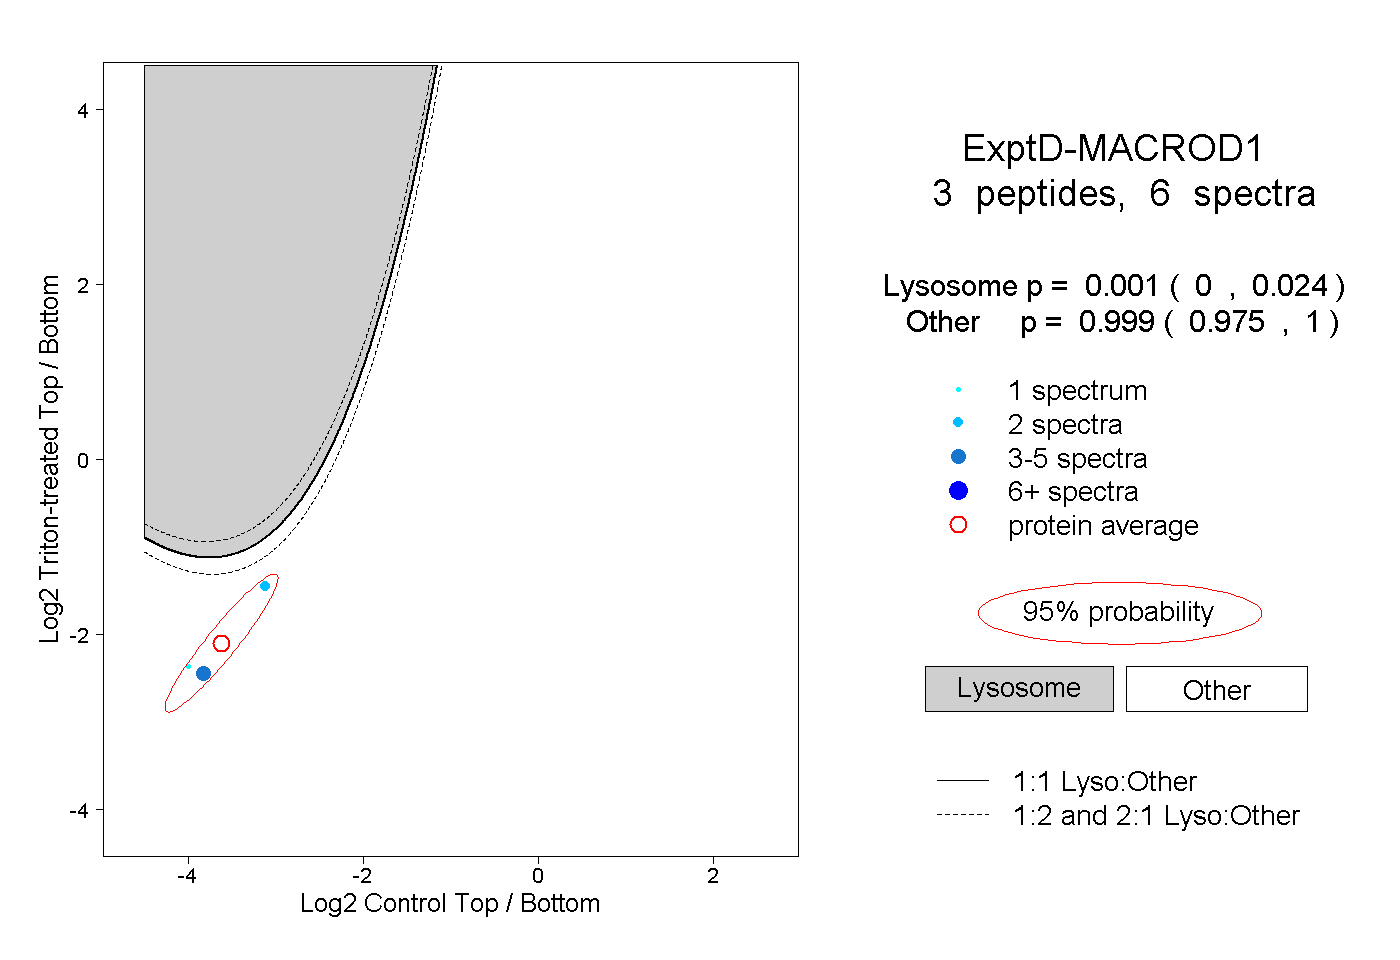 |
0.001 0.000 | 0.024 |
0.999 0.975 | 1.000 |