 14
14peptides
spectra
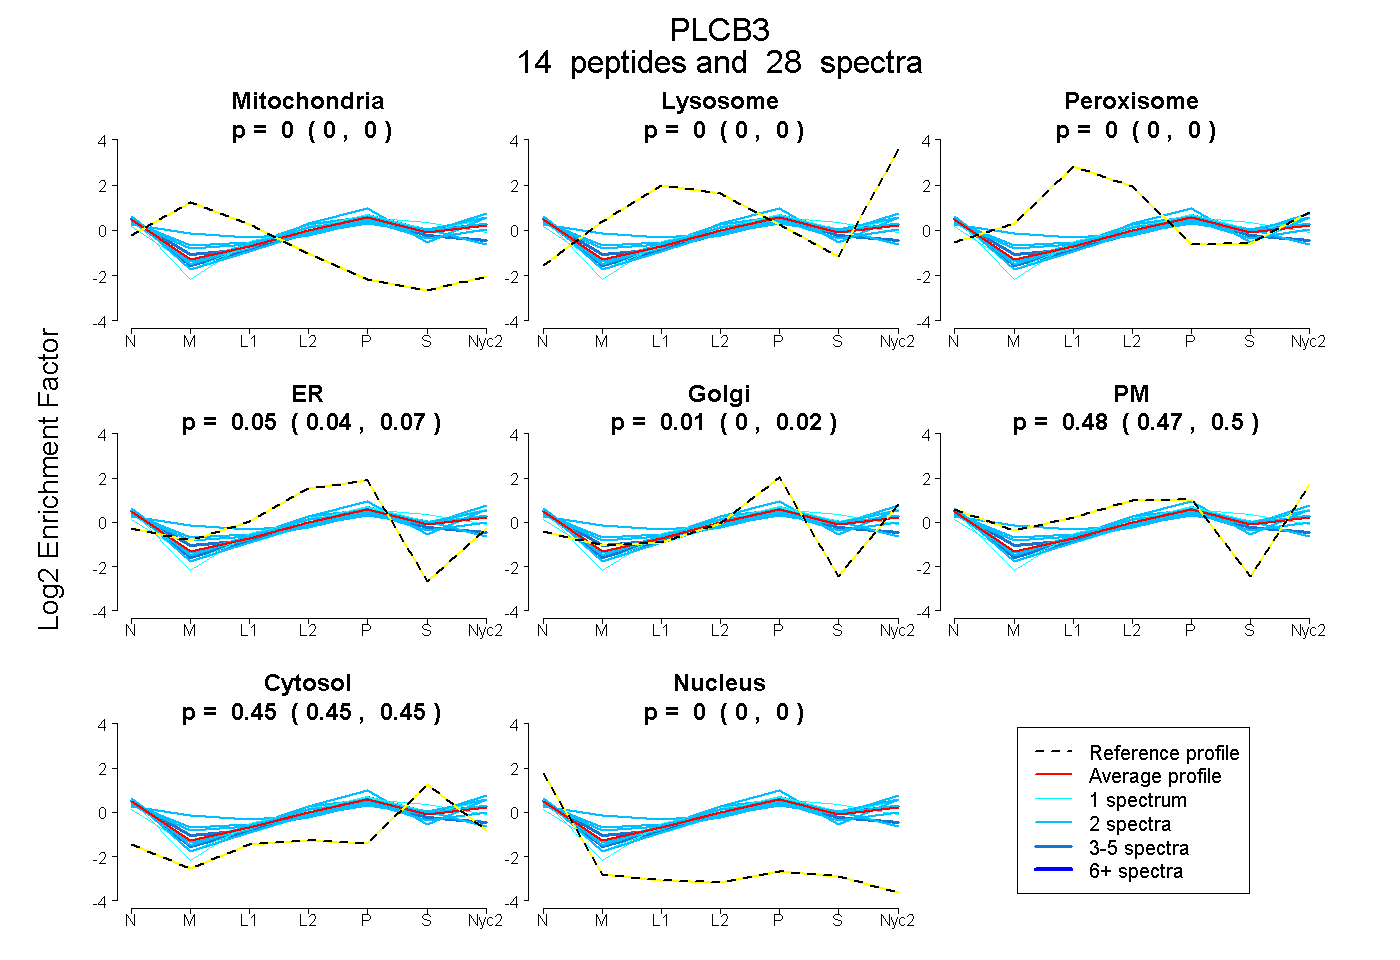
0.000 | 0.000
0.000 | 0.000
0.000 | 0.000
0.037 | 0.069
0.000 | 0.021
0.468 | 0.496
0.447 | 0.454
0.000 | 0.001
3peptides
spectra
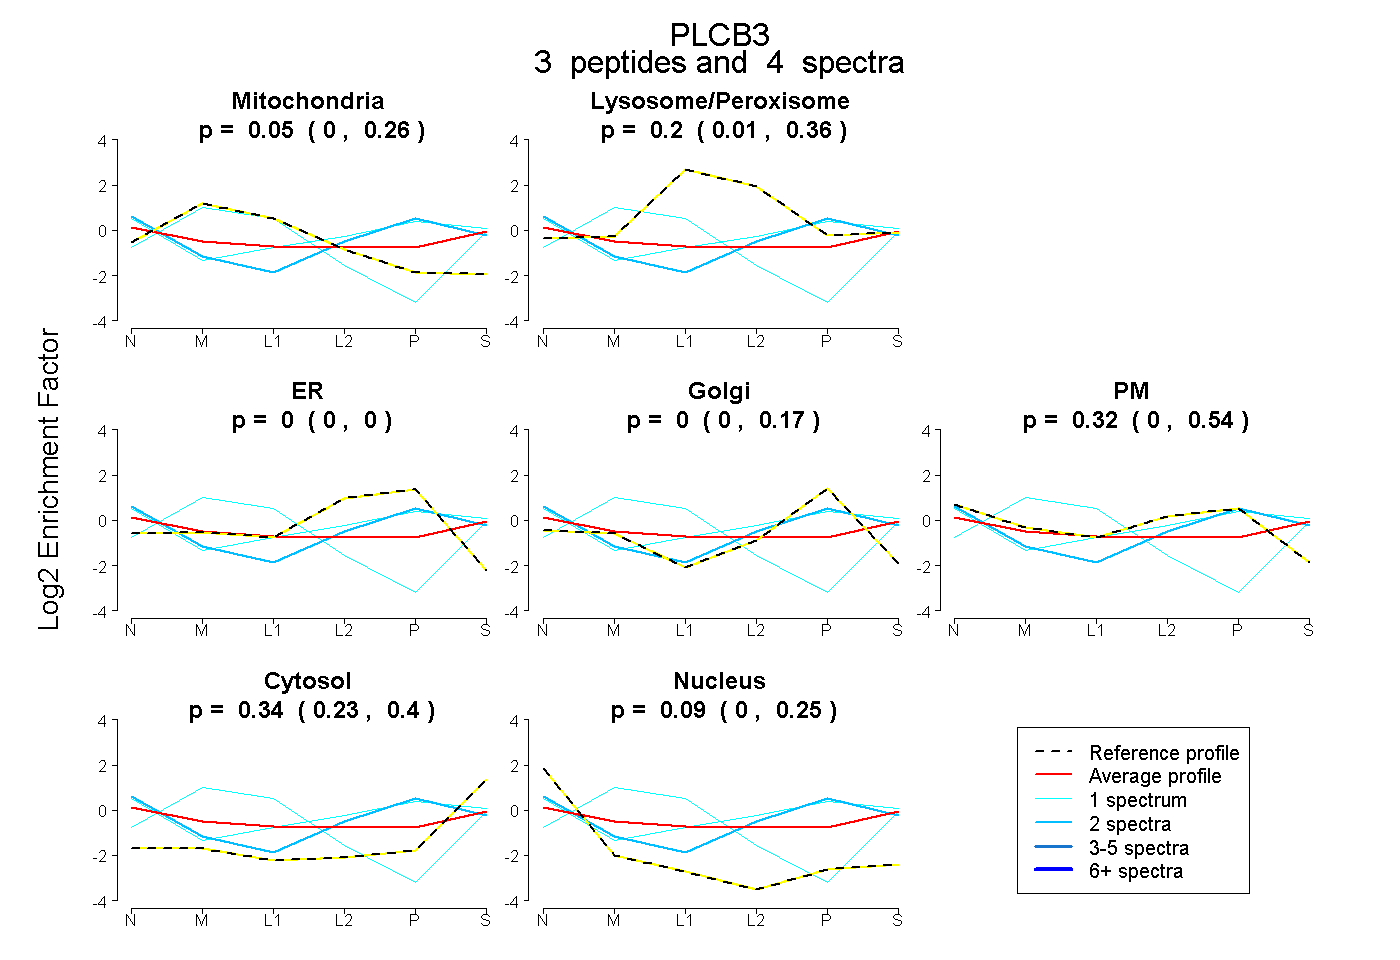
0.000 | 0.265
0.013 | 0.360
0.000 | 0.000
0.000 | 0.165
0.000 | 0.542
0.234 | 0.404
0.000 | 0.252
17peptides
spectra
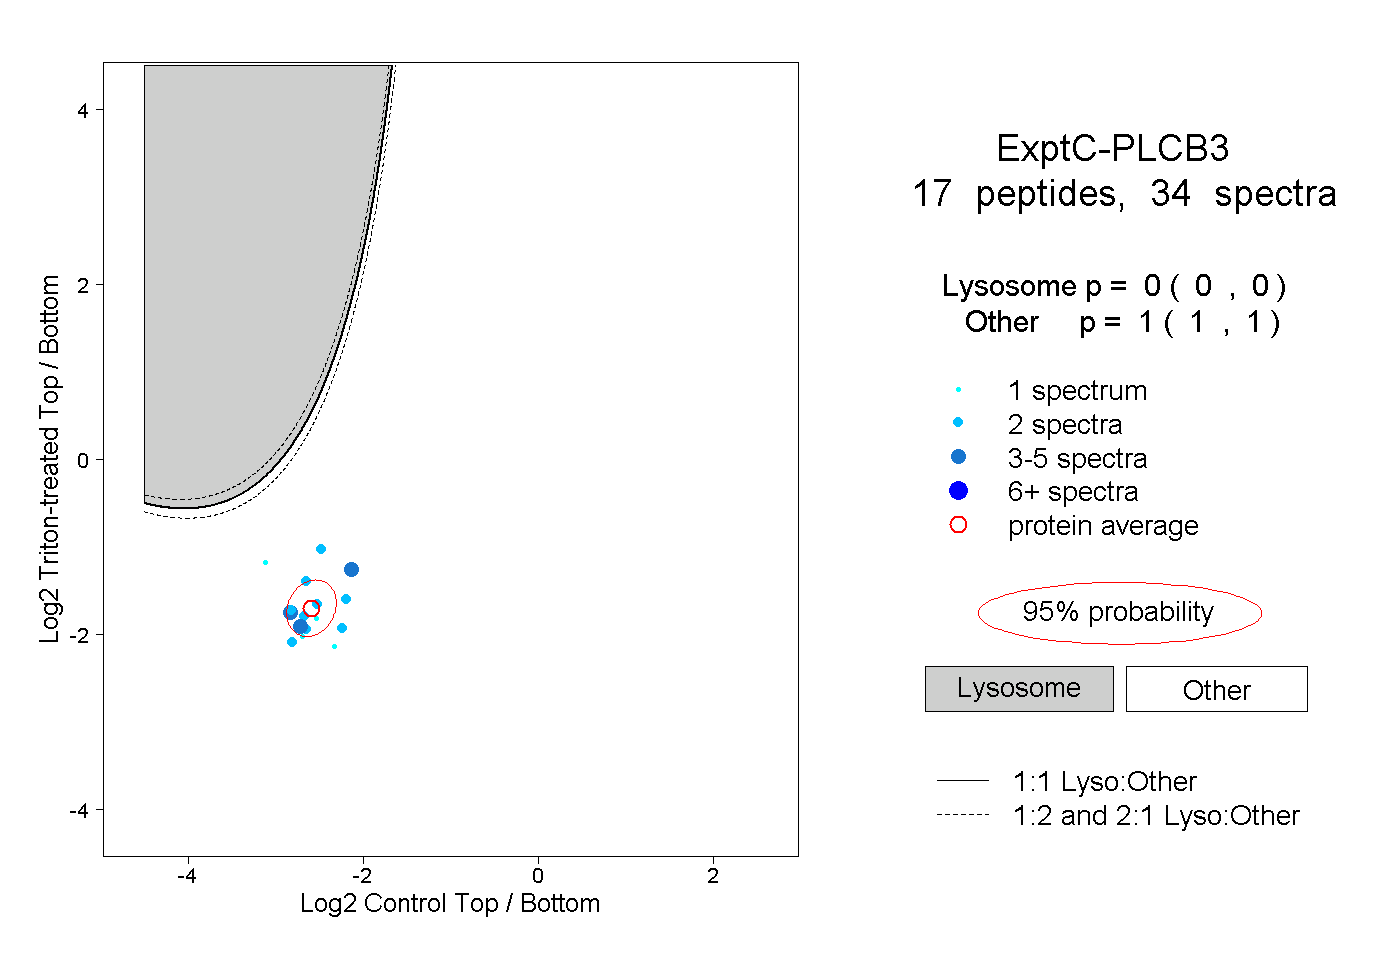
0.000 | 0.000
1.000 | 1.000
1peptide
spectra
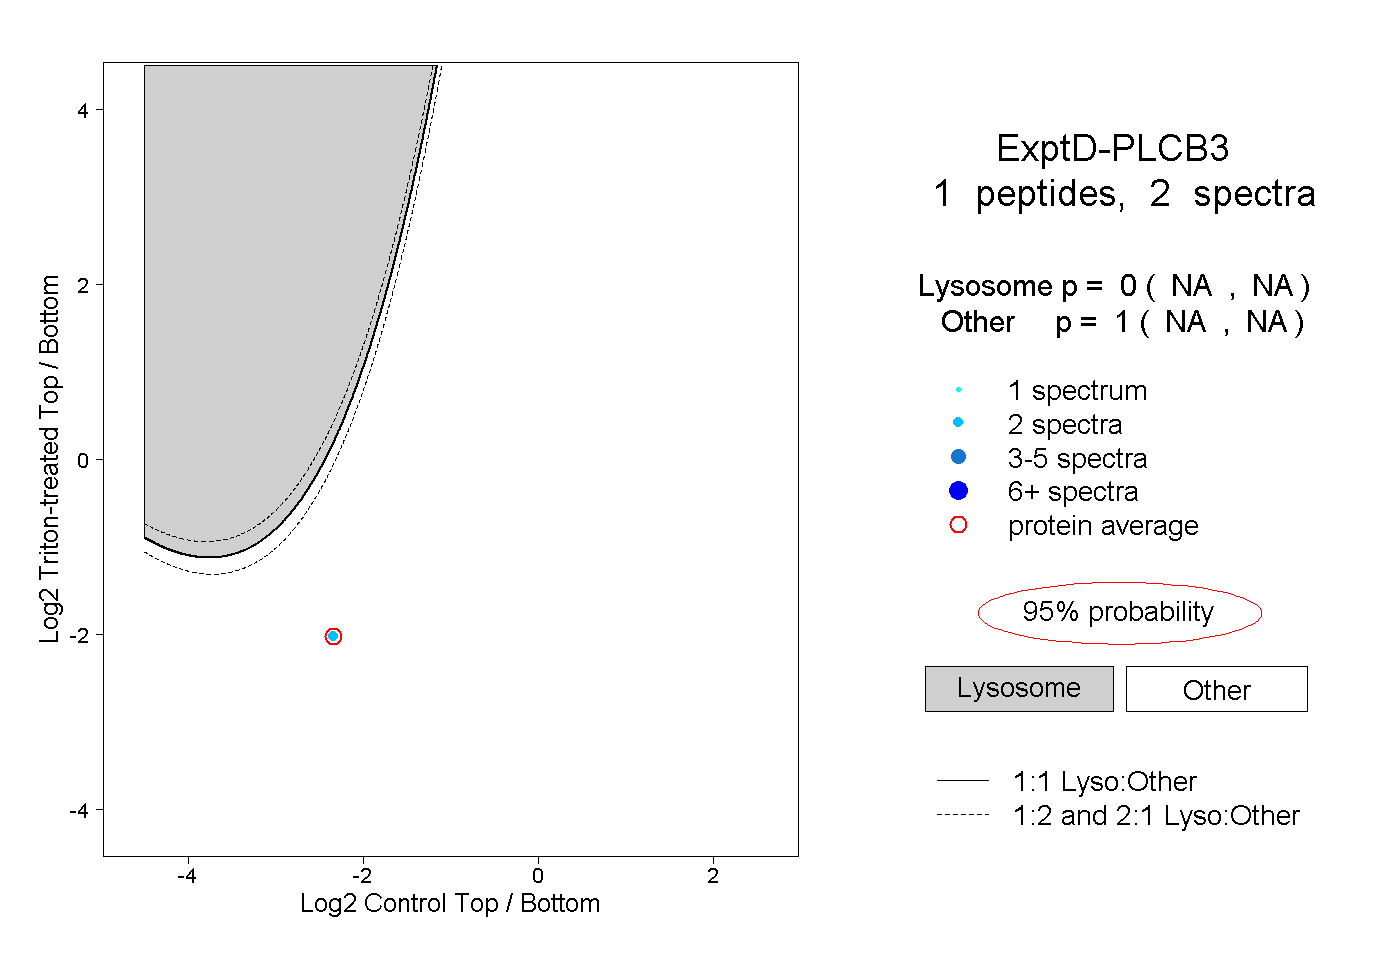
NA | NA
NA | NA