 14
14peptides
spectra
0.000 | 0.000
0.000 | 0.000
0.000 | 0.000
0.037 | 0.069
0.000 | 0.021
0.468 | 0.496
0.447 | 0.454
0.000 | 0.001
| Plot | Mito | Lyso | Perox | ER | Golgi | PM | Cytosol | Nucleus | |||||
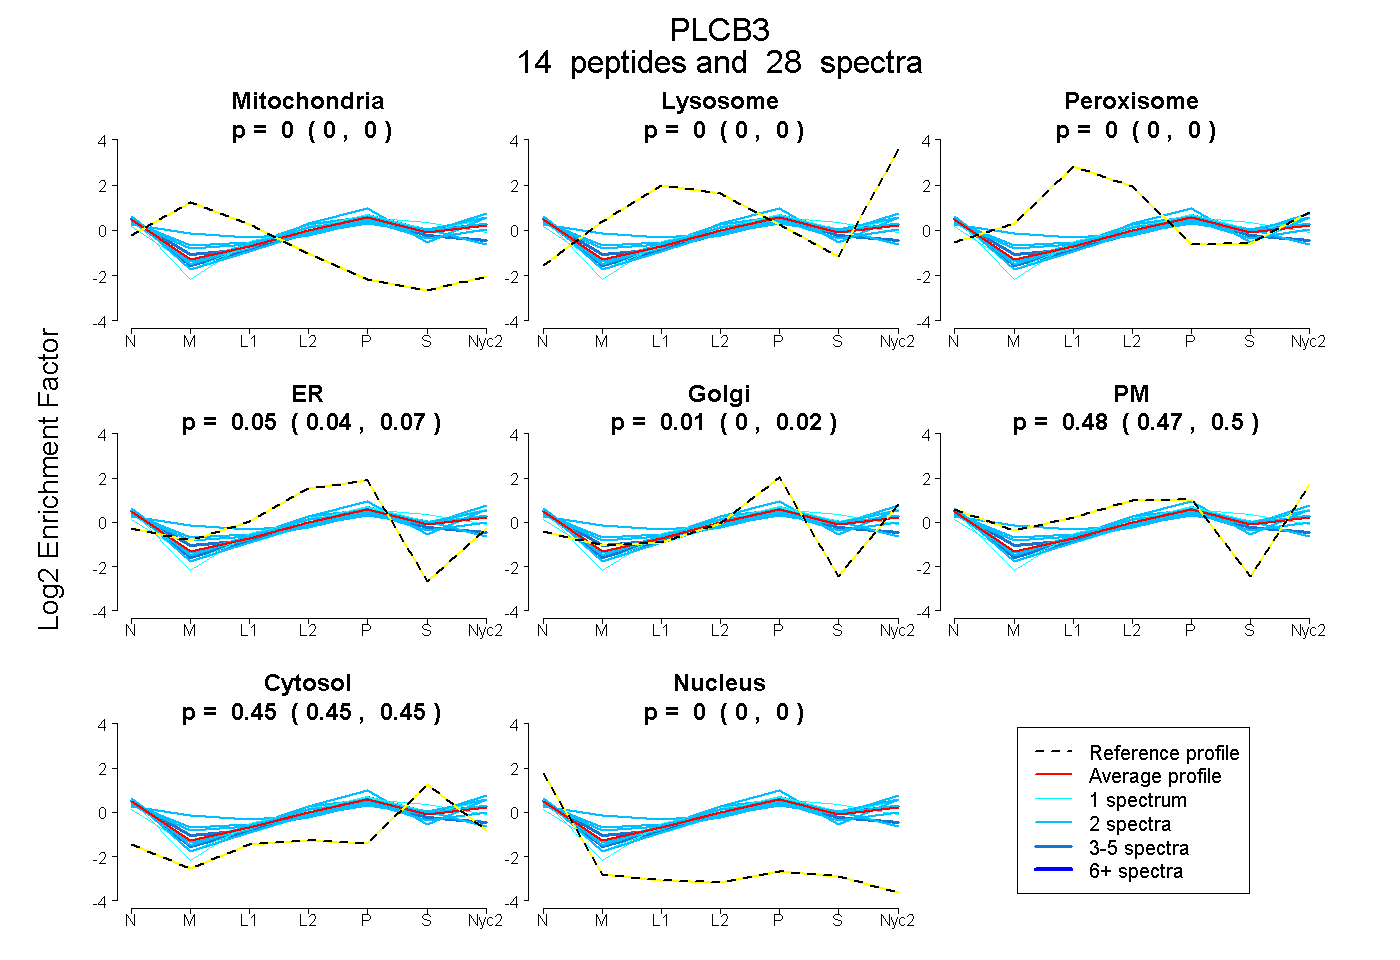
| Expt A |
14 peptides |
28 spectra |
|
0.000 0.000 | 0.000 |
0.000 0.000 | 0.000 |
0.000 0.000 | 0.000 |
0.055 0.037 | 0.069 |
0.012 0.000 | 0.021 |
0.483 0.468 | 0.496 |
0.451 0.447 | 0.454 |
0.000 0.000 | 0.001 |
| 2 spectra, WDEEASSR | 0.000 | 0.000 | 0.000 | 0.000 | 0.000 | 0.551 | 0.449 | 0.000 | ||
| 1 spectrum, SLGEEGLNR | 0.000 | 0.000 | 0.000 | 0.112 | 0.000 | 0.405 | 0.483 | 0.000 | ||
| 2 spectra, QALLWGCR | 0.000 | 0.000 | 0.035 | 0.356 | 0.000 | 0.137 | 0.452 | 0.020 | ||
| 2 spectra, VWSEELFK | 0.000 | 0.000 | 0.000 | 0.025 | 0.000 | 0.518 | 0.457 | 0.000 | ||
| 2 spectra, EVLGFGGPDTR | 0.000 | 0.000 | 0.019 | 0.000 | 0.000 | 0.569 | 0.413 | 0.000 | ||
| 5 spectra, CRPSSSALSR | 0.000 | 0.000 | 0.000 | 0.226 | 0.000 | 0.303 | 0.411 | 0.061 | ||
| 2 spectra, VVLPTLASLR | 0.000 | 0.000 | 0.000 | 0.000 | 0.077 | 0.434 | 0.466 | 0.022 | ||
| 1 spectrum, LAMNILAQNASR | 0.000 | 0.000 | 0.000 | 0.000 | 0.015 | 0.551 | 0.434 | 0.000 | ||
| 2 spectra, NLVTLR | 0.118 | 0.000 | 0.111 | 0.000 | 0.152 | 0.323 | 0.297 | 0.000 | ||
| 1 spectrum, DVLEAIAETAFK | 0.000 | 0.000 | 0.000 | 0.124 | 0.072 | 0.266 | 0.539 | 0.000 | ||
| 1 spectrum, IAAFEEGGR | 0.000 | 0.000 | 0.000 | 0.000 | 0.058 | 0.509 | 0.433 | 0.000 | ||
| 1 spectrum, LNEVLYPPLR | 0.000 | 0.000 | 0.000 | 0.000 | 0.033 | 0.522 | 0.446 | 0.000 | ||
| 4 spectra, ILPVSAIR | 0.000 | 0.000 | 0.000 | 0.000 | 0.111 | 0.430 | 0.459 | 0.000 | ||
| 2 spectra, LLDGLAQAR | 0.000 | 0.000 | 0.000 | 0.030 | 0.145 | 0.490 | 0.336 | 0.000 |
| Plot | Mito | Lyso or Perox | ER | Golgi | PM | Cytosol | Nucleus | ||||||
| Expt B |
3 peptides |
4 spectra |
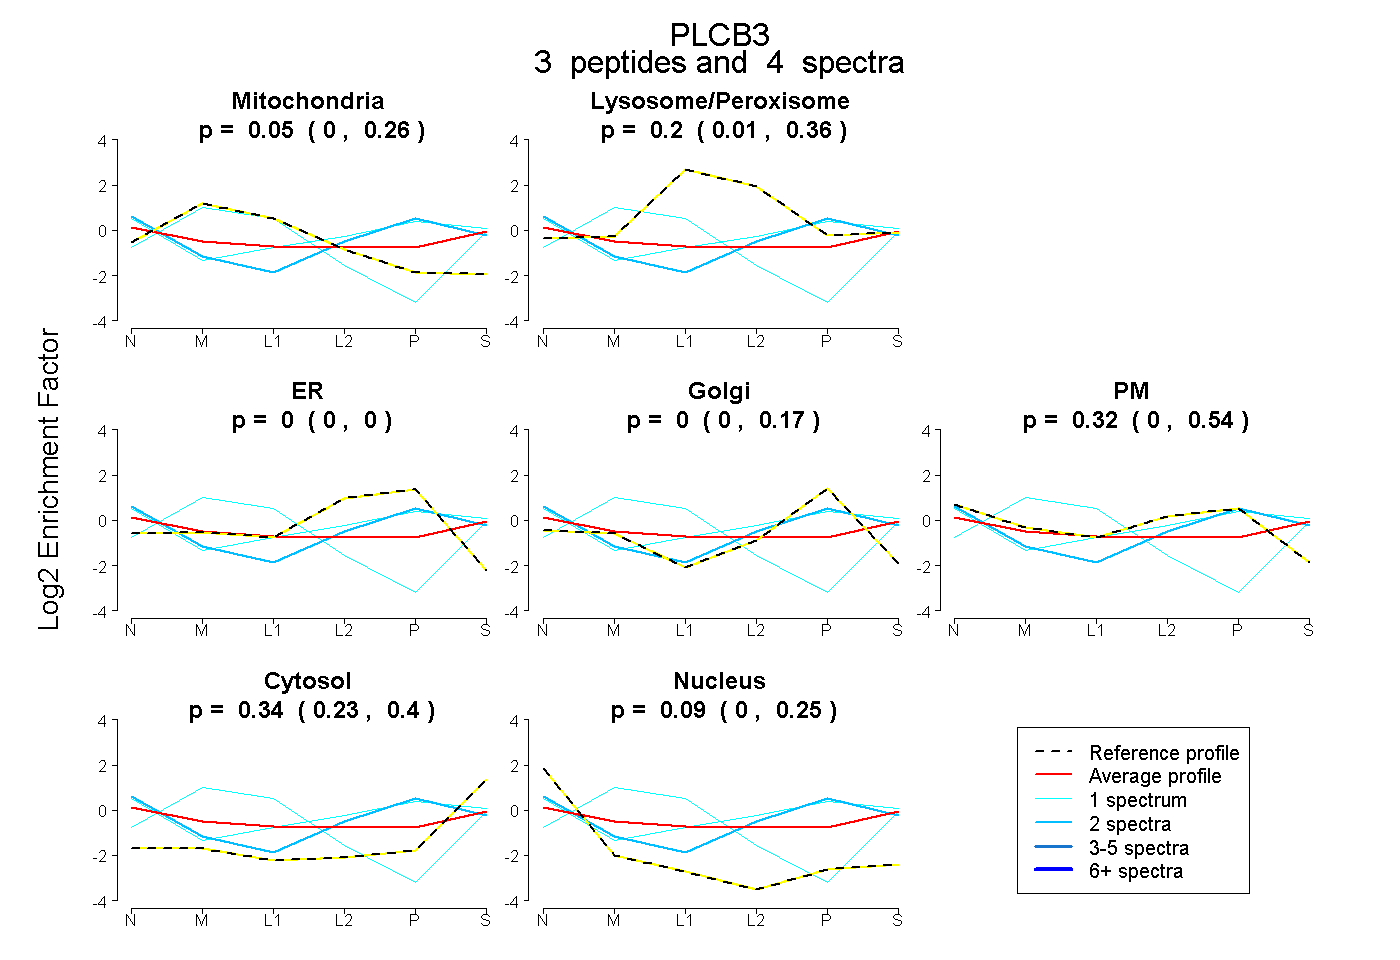 |
0.052 0.000 | 0.265 |
0.196 0.013 | 0.360 |
0.000 0.000 | 0.000 |
0.000 0.000 | 0.165 |
0.319 0.000 | 0.542 |
0.344 0.234 | 0.404 |
0.089 0.000 | 0.252 |
|||
| Plot | Lyso | Other | |||||||||||
| Expt C |
17 peptides |
34 spectra |
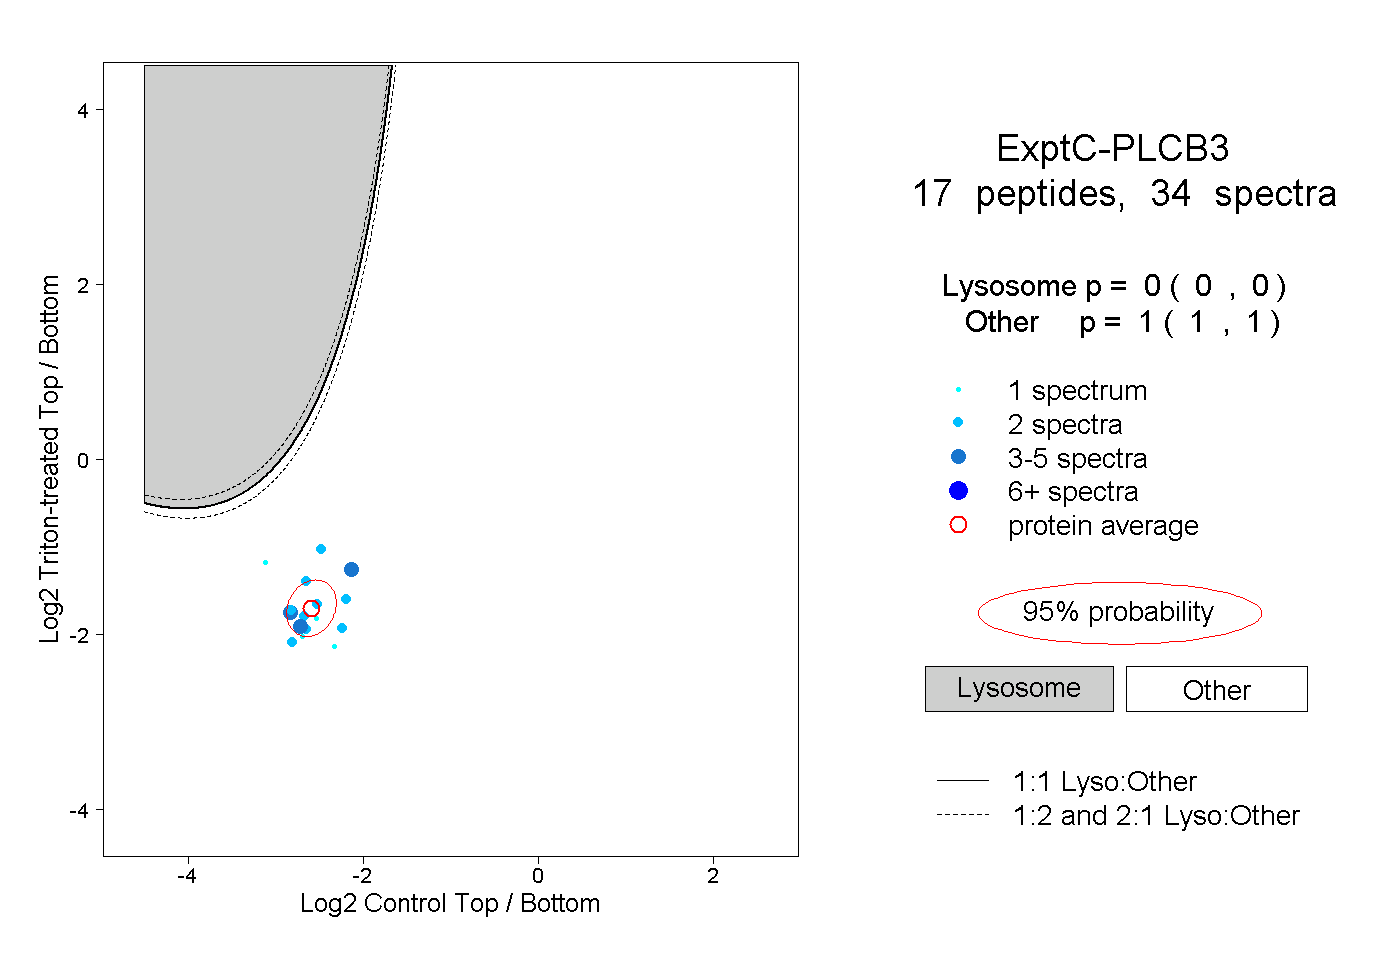 |
0.000 0.000 | 0.000 |
1.000 1.000 | 1.000 |
||||||||
| Plot | Lyso | Other | |||||||||||
| Expt D |
1 peptide |
2 spectra |
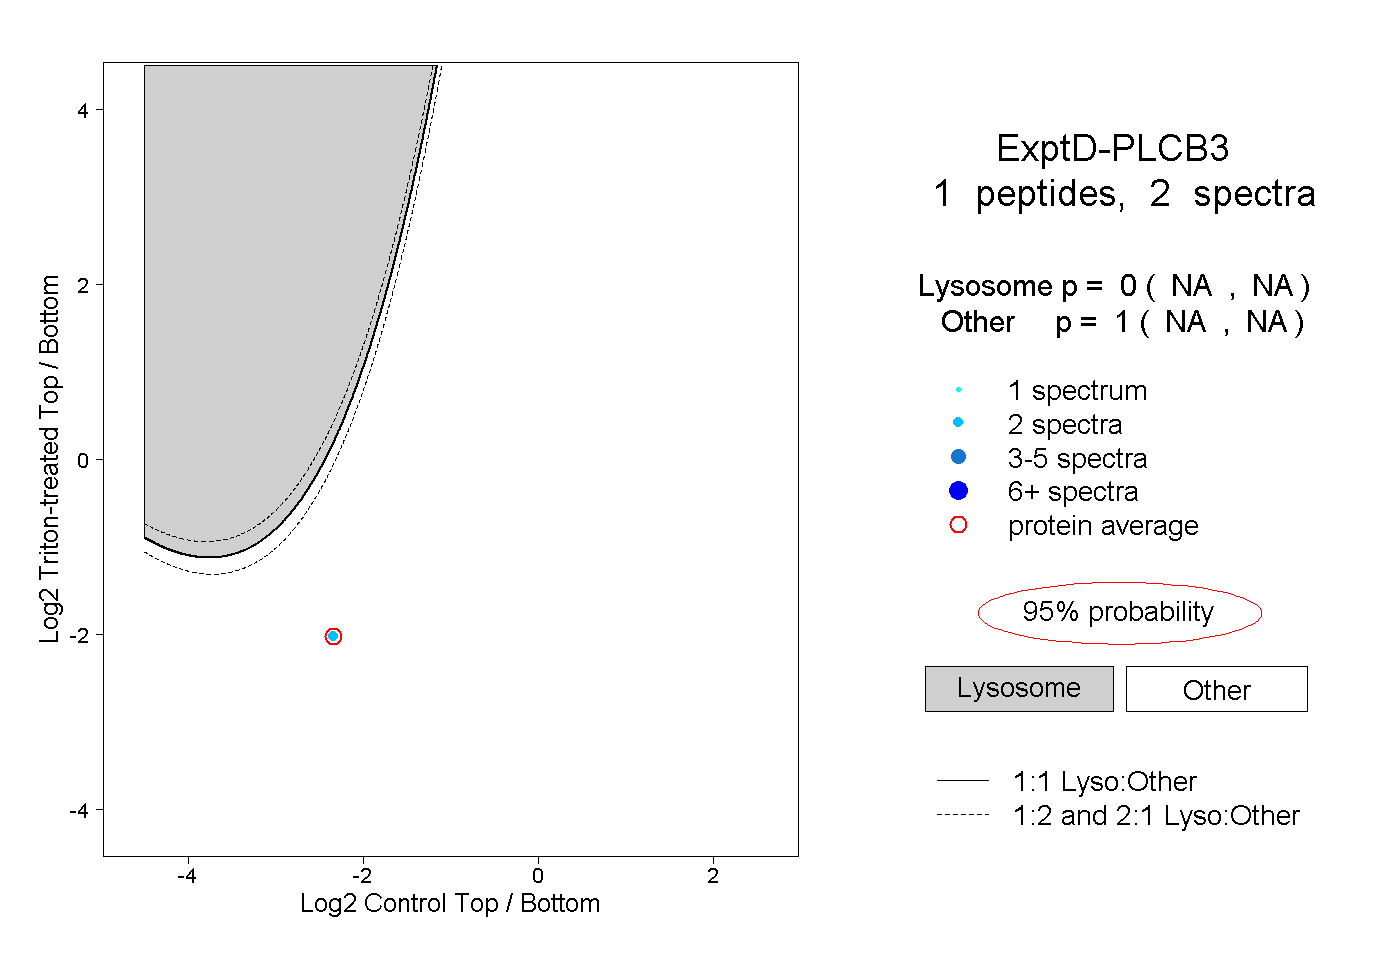 |
0.000 NA | NA |
1.000 NA | NA |