 5
5peptides
spectra
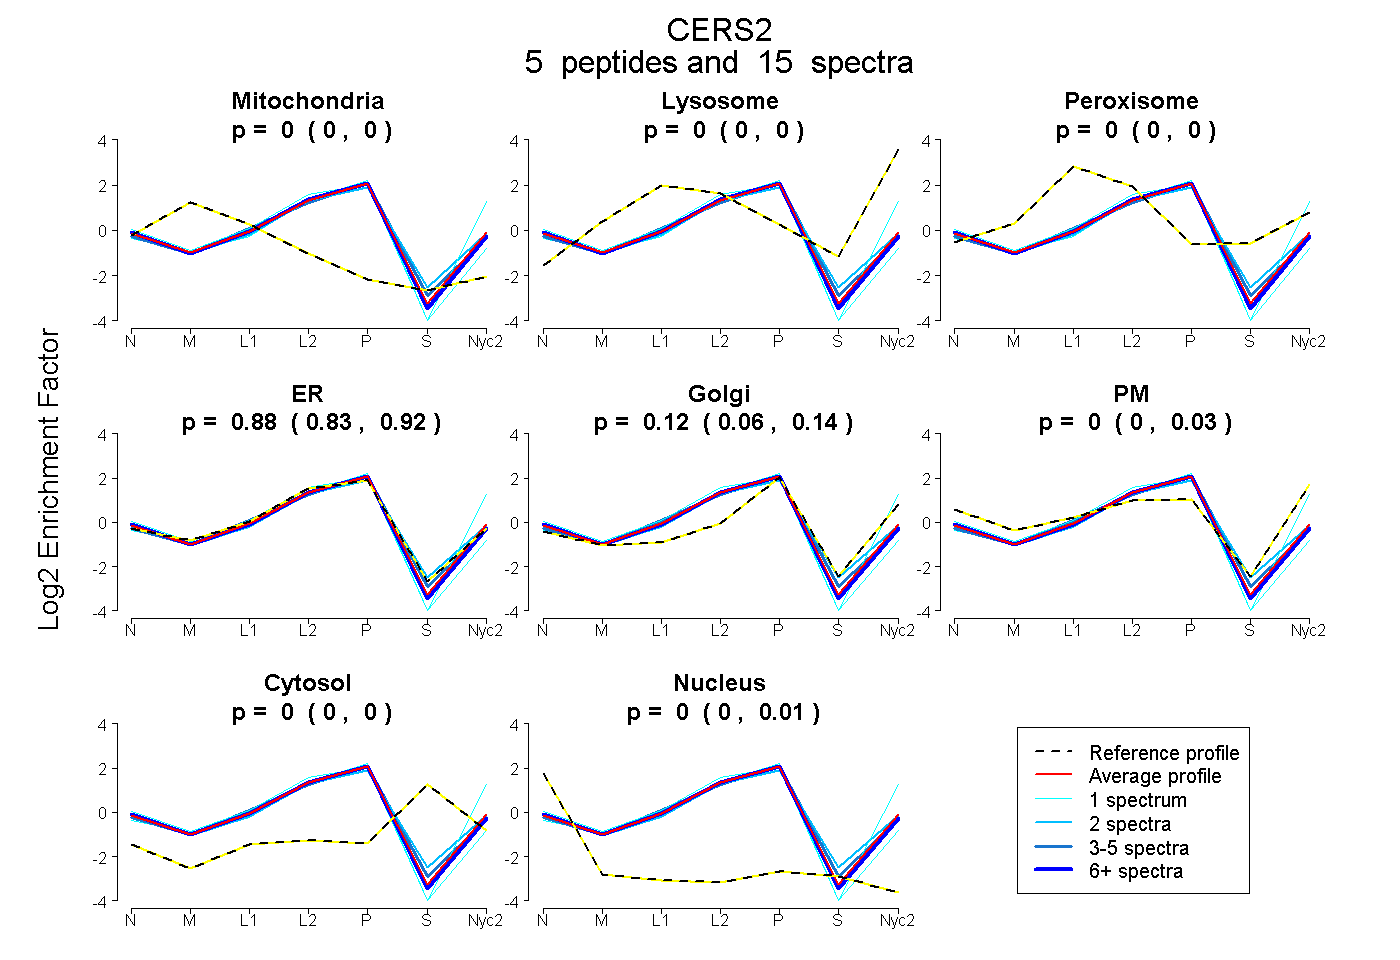
0.000 | 0.000
0.000 | 0.000
0.000 | 0.000
0.829 | 0.916
0.064 | 0.139
0.000 | 0.029
0.000 | 0.000
0.000 | 0.011
2peptides
spectra
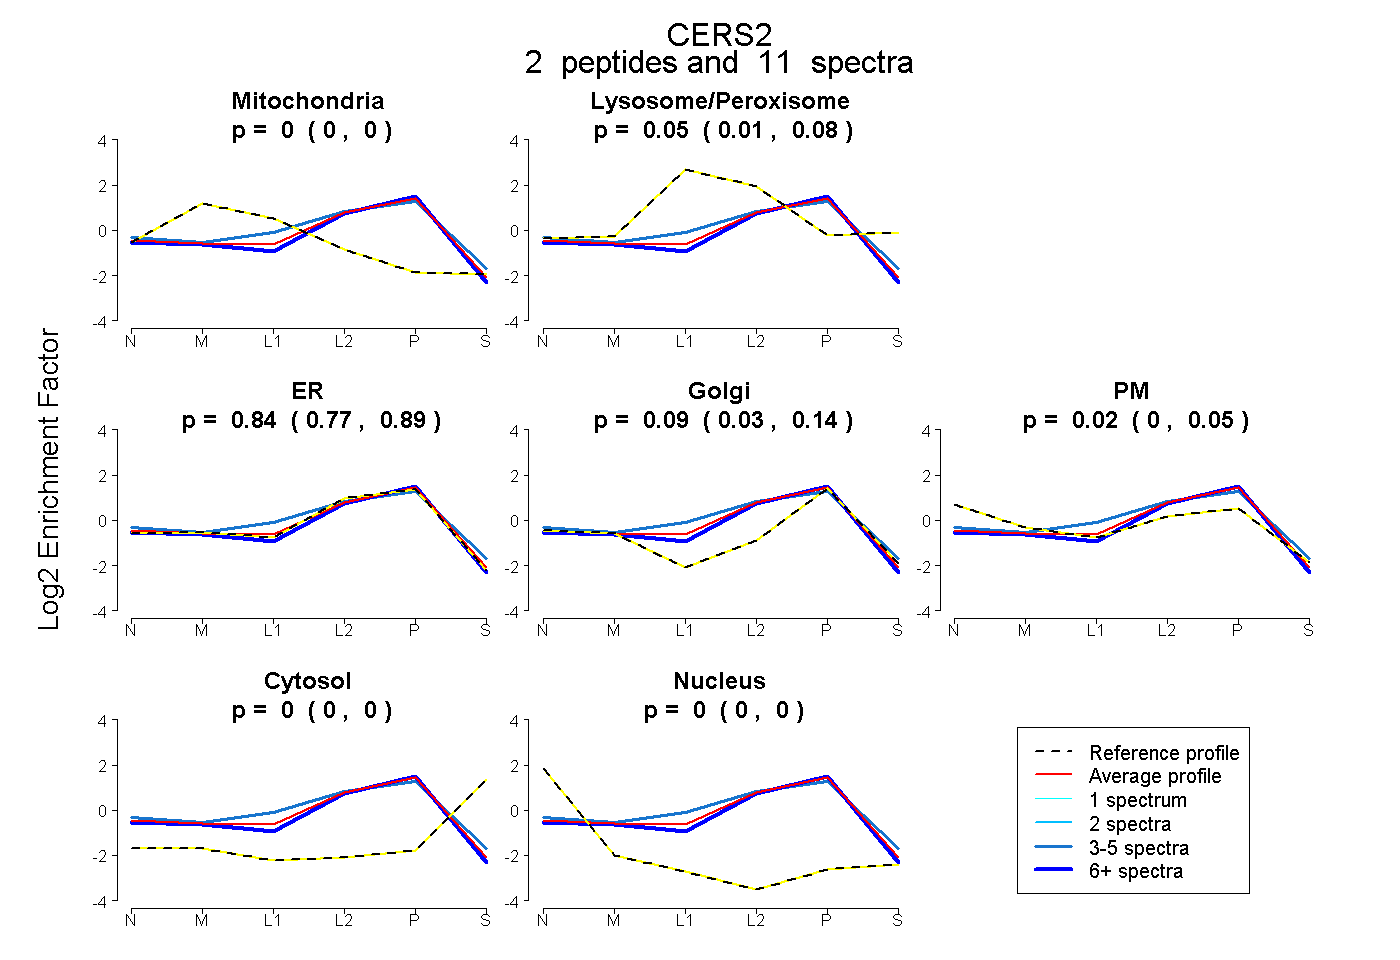
0.000 | 0.000
0.005 | 0.078
0.772 | 0.894
0.028 | 0.140
0.000 | 0.055
0.000 | 0.000
0.000 | 0.000
4peptides
spectra

0.000 | 0.000
1.000 | 1.000
2peptides
spectra
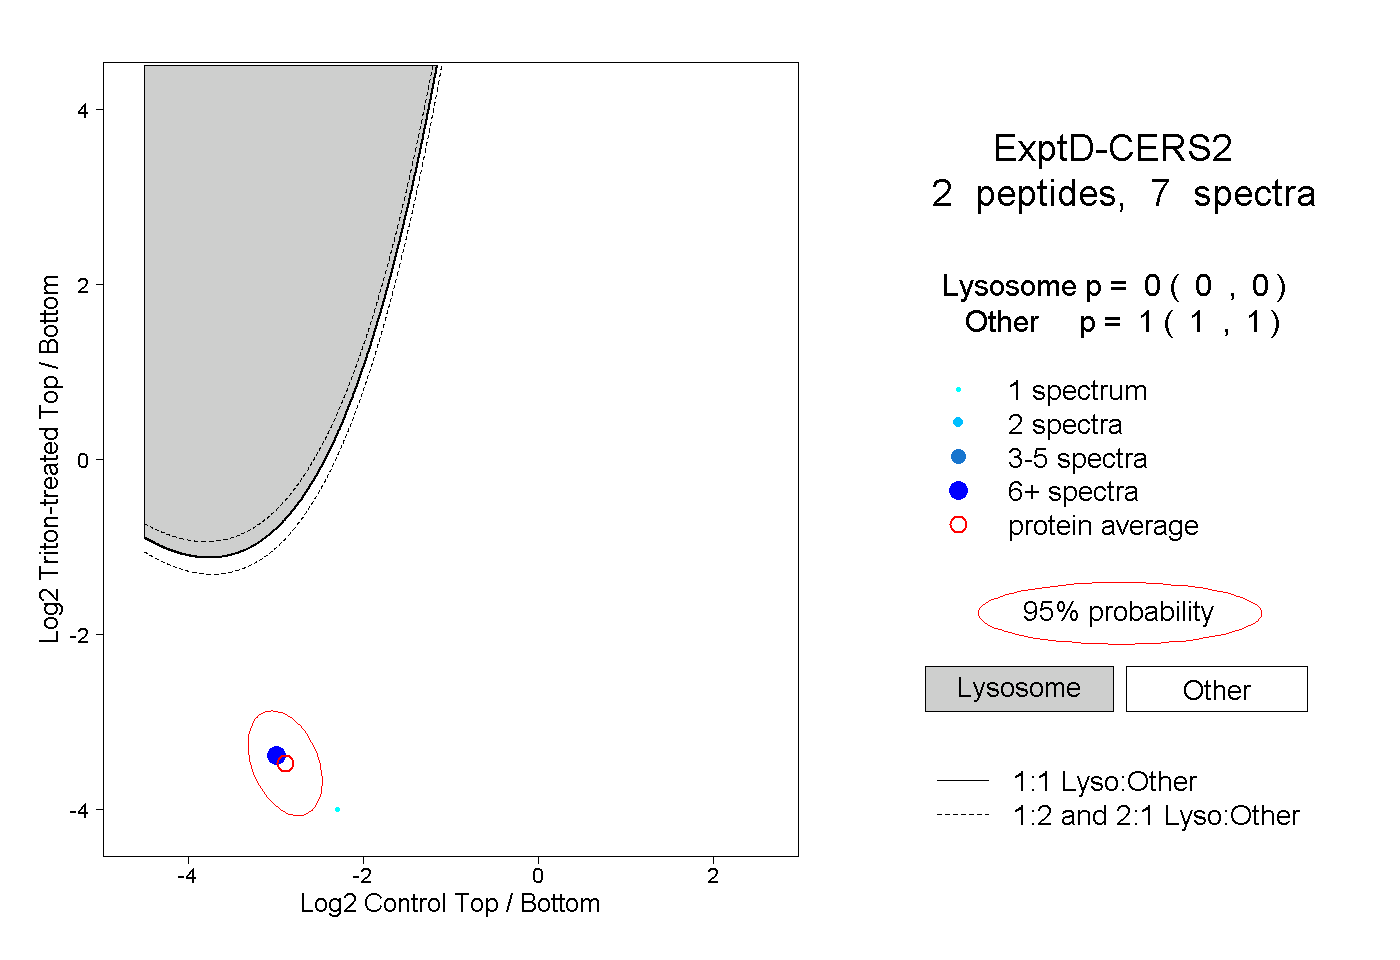
0.000 | 0.000
1.000 | 1.000