 5
5peptides
spectra
0.000 | 0.000
0.000 | 0.000
0.000 | 0.000
0.829 | 0.916
0.064 | 0.139
0.000 | 0.029
0.000 | 0.000
0.000 | 0.011
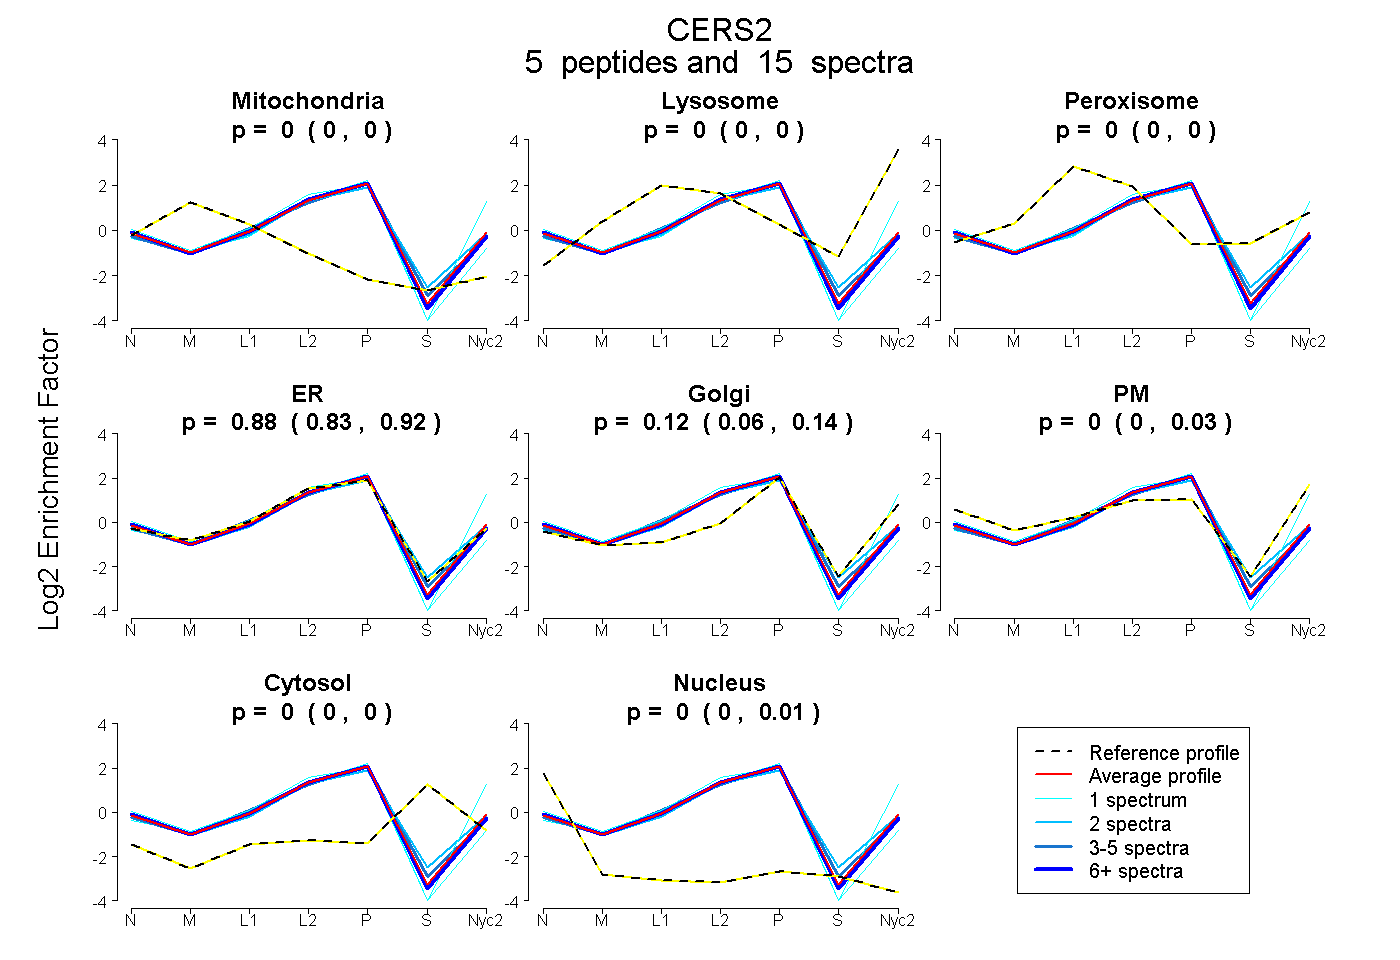
| Plot | Mito | Lyso | Perox | ER | Golgi | PM | Cytosol | Nucleus | |||||
| Expt A |
5 peptides |
15 spectra |
|
0.000 0.000 | 0.000 |
0.000 0.000 | 0.000 |
0.000 0.000 | 0.000 |
0.881 0.829 | 0.916 |
0.118 0.064 | 0.139 |
0.000 0.000 | 0.029 |
0.000 0.000 | 0.000 |
0.001 0.000 | 0.011 |
| 2 spectra, NQDRPSLLK | 0.000 | 0.000 | 0.000 | 0.835 | 0.136 | 0.006 | 0.008 | 0.016 | ||
| 1 spectrum, QSGLSGR | 0.000 | 0.000 | 0.000 | 0.506 | 0.000 | 0.494 | 0.000 | 0.000 | ||
| 4 spectra, MFNYAGWK | 0.000 | 0.000 | 0.000 | 0.924 | 0.064 | 0.000 | 0.000 | 0.011 | ||
| 7 spectra, QVEVDLLSR | 0.000 | 0.000 | 0.000 | 0.936 | 0.047 | 0.000 | 0.000 | 0.017 | ||
| 1 spectrum, APPNATLEHFYLTVGK | 0.000 | 0.000 | 0.000 | 0.963 | 0.000 | 0.000 | 0.000 | 0.037 |
| Plot | Mito | Lyso or Perox | ER | Golgi | PM | Cytosol | Nucleus | ||||||
| Expt B |
2 peptides |
11 spectra |
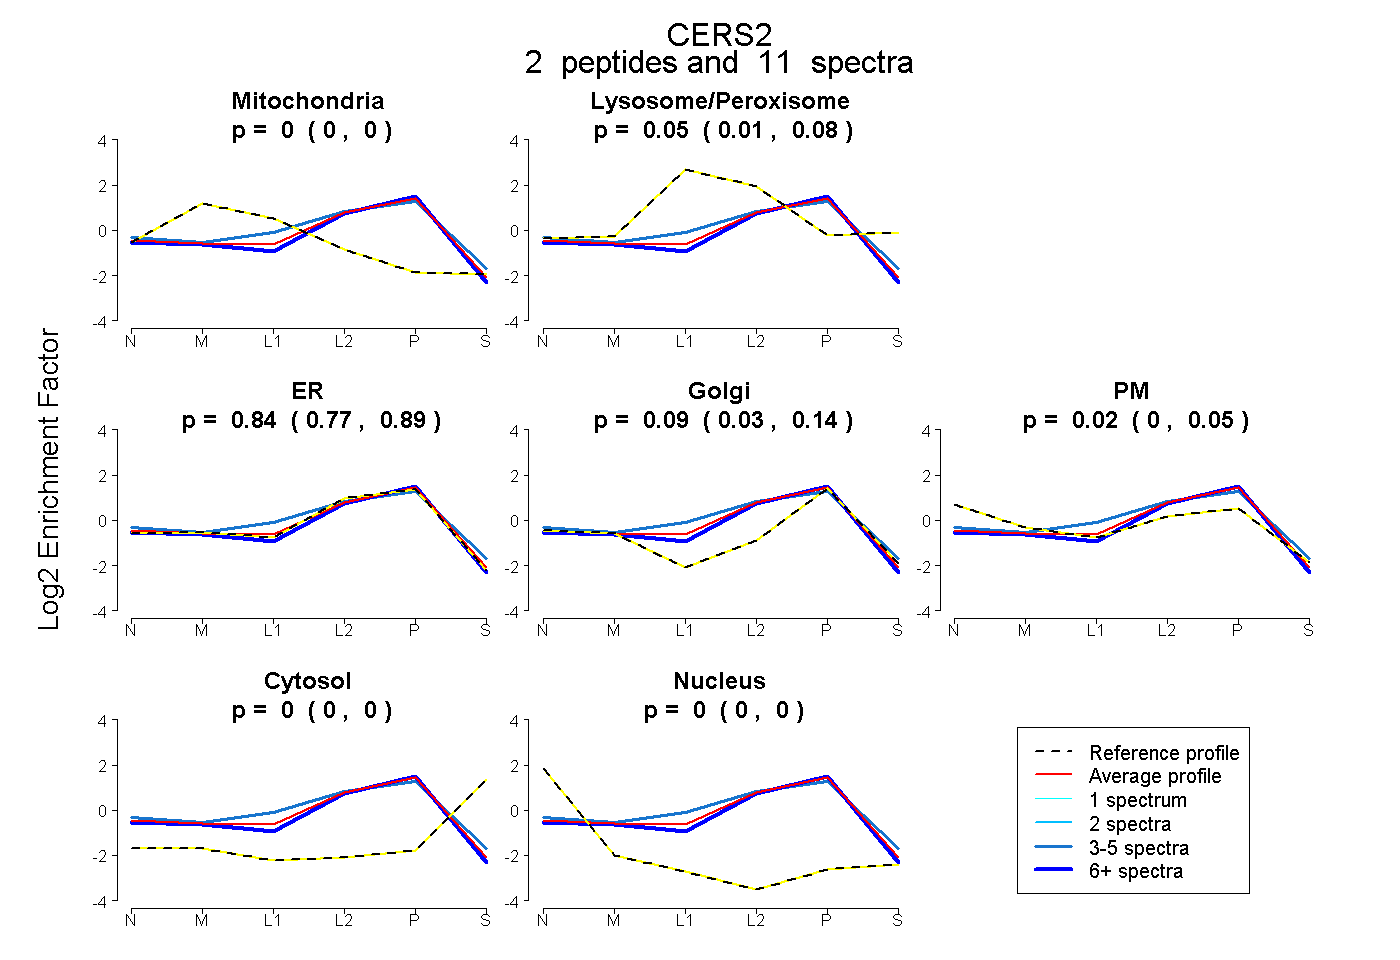 |
0.000 0.000 | 0.000 |
0.048 0.005 | 0.078 |
0.840 0.772 | 0.894 |
0.093 0.028 | 0.140 |
0.019 0.000 | 0.055 |
0.000 0.000 | 0.000 |
0.000 0.000 | 0.000 |
|||
| Plot | Lyso | Other | |||||||||||
| Expt C |
4 peptides |
18 spectra |
 |
0.000 0.000 | 0.000 |
1.000 1.000 | 1.000 |
||||||||
| Plot | Lyso | Other | |||||||||||
| Expt D |
2 peptides |
7 spectra |
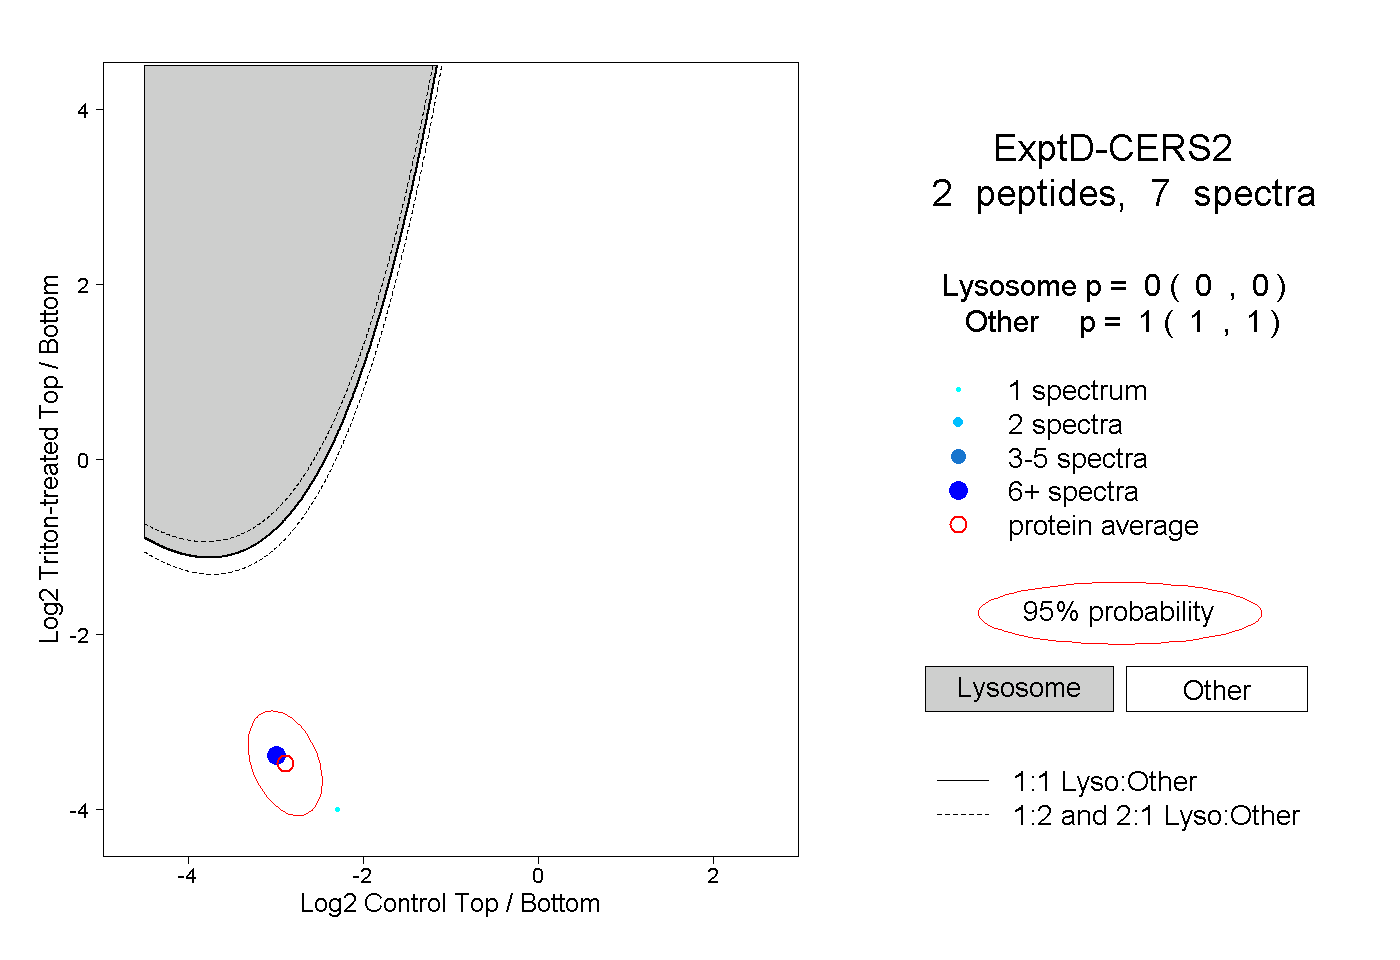 |
0.000 0.000 | 0.000 |
1.000 1.000 | 1.000 |