 5
5peptides
spectra
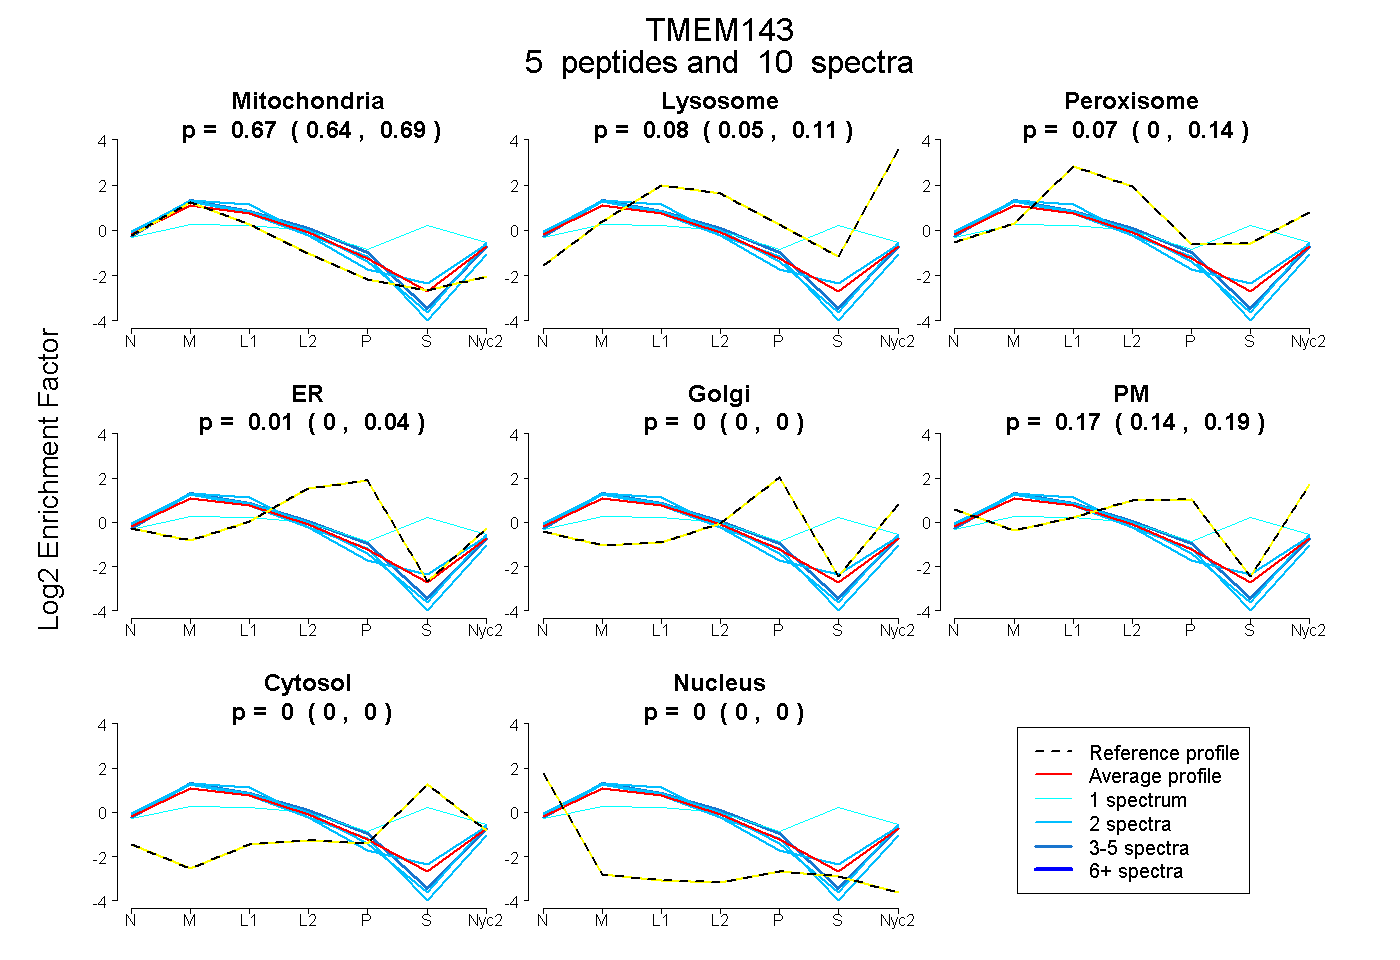
0.637 | 0.690
0.053 | 0.110
0.000 | 0.135
0.000 | 0.040
0.000 | 0.000
0.138 | 0.190
0.000 | 0.000
0.000 | 0.000
15peptides
spectra
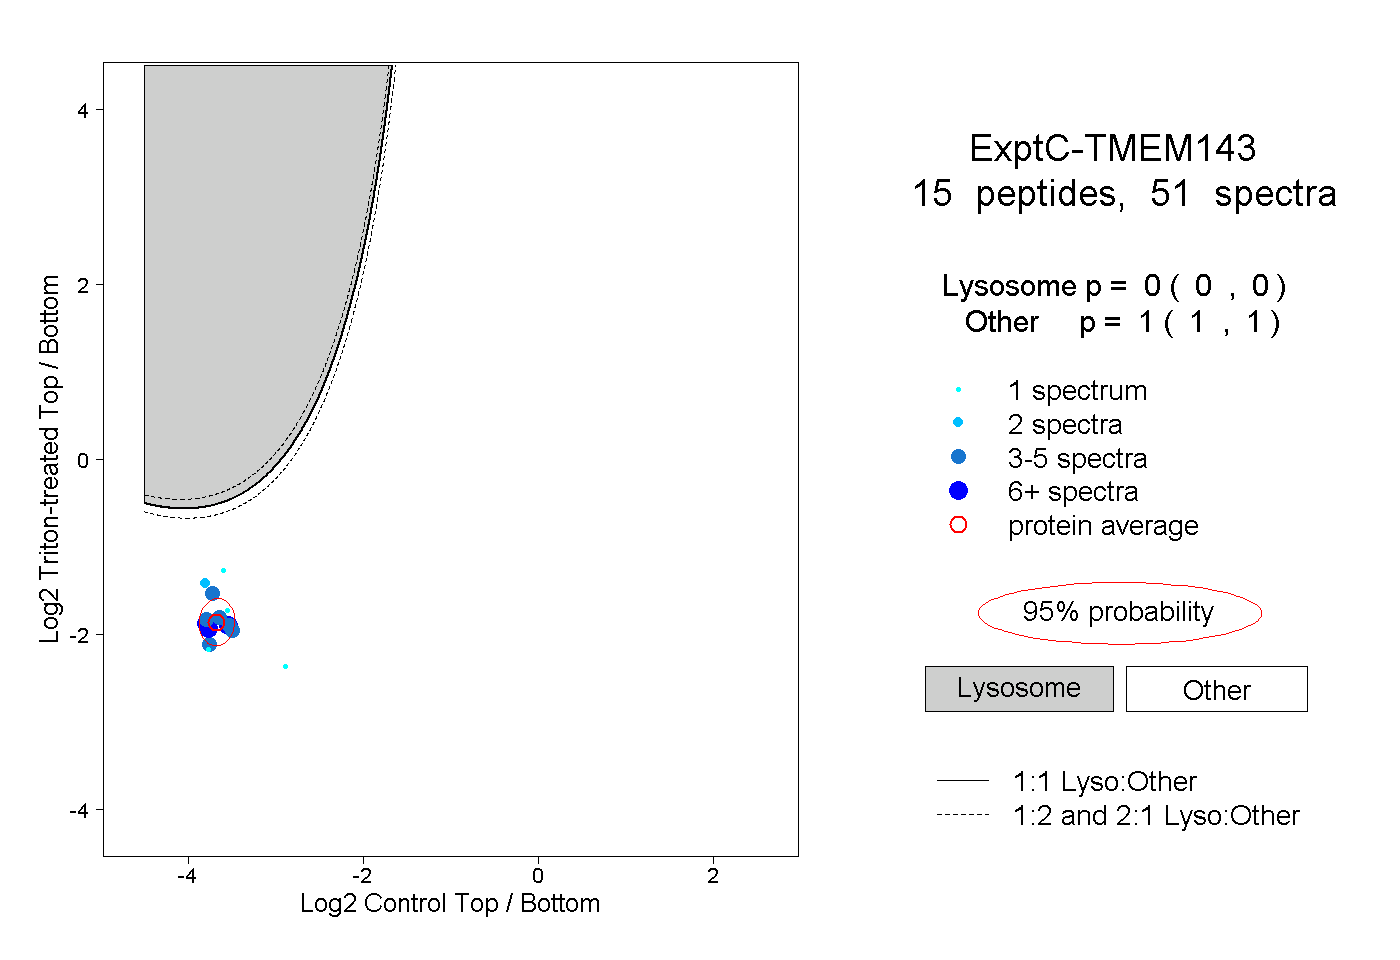
0.000 | 0.000
1.000 | 1.000
4peptides
spectra
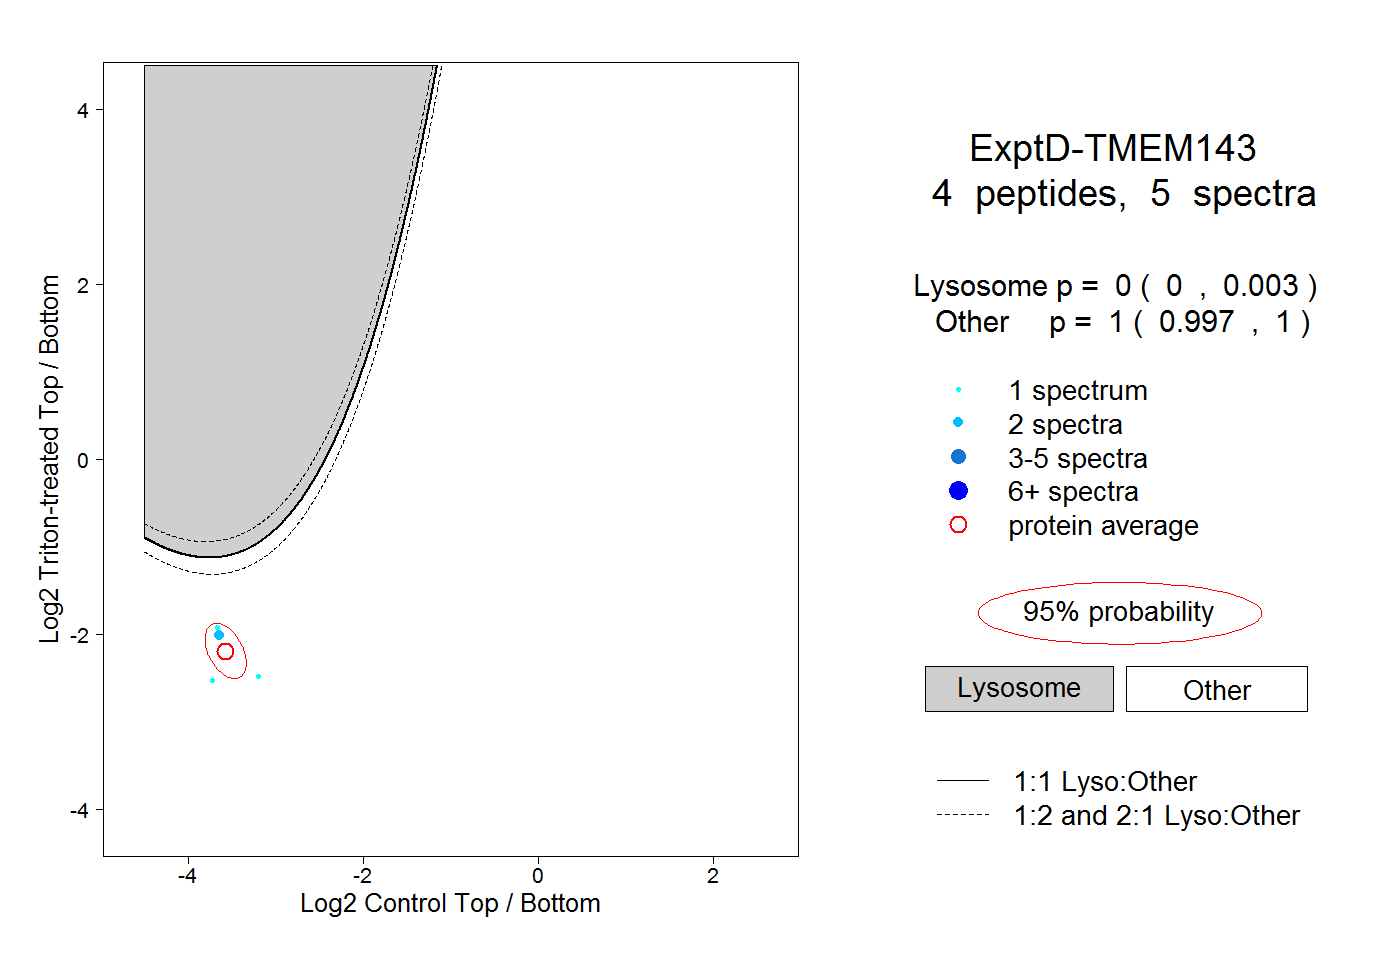
0.000 | 0.003
0.997 | 1.000