 5
5peptides
spectra
0.637 | 0.690
0.053 | 0.110
0.000 | 0.135
0.000 | 0.040
0.000 | 0.000
0.138 | 0.190
0.000 | 0.000
0.000 | 0.000
| Plot | Mito | Lyso | Perox | ER | Golgi | PM | Cytosol | Nucleus | |||||
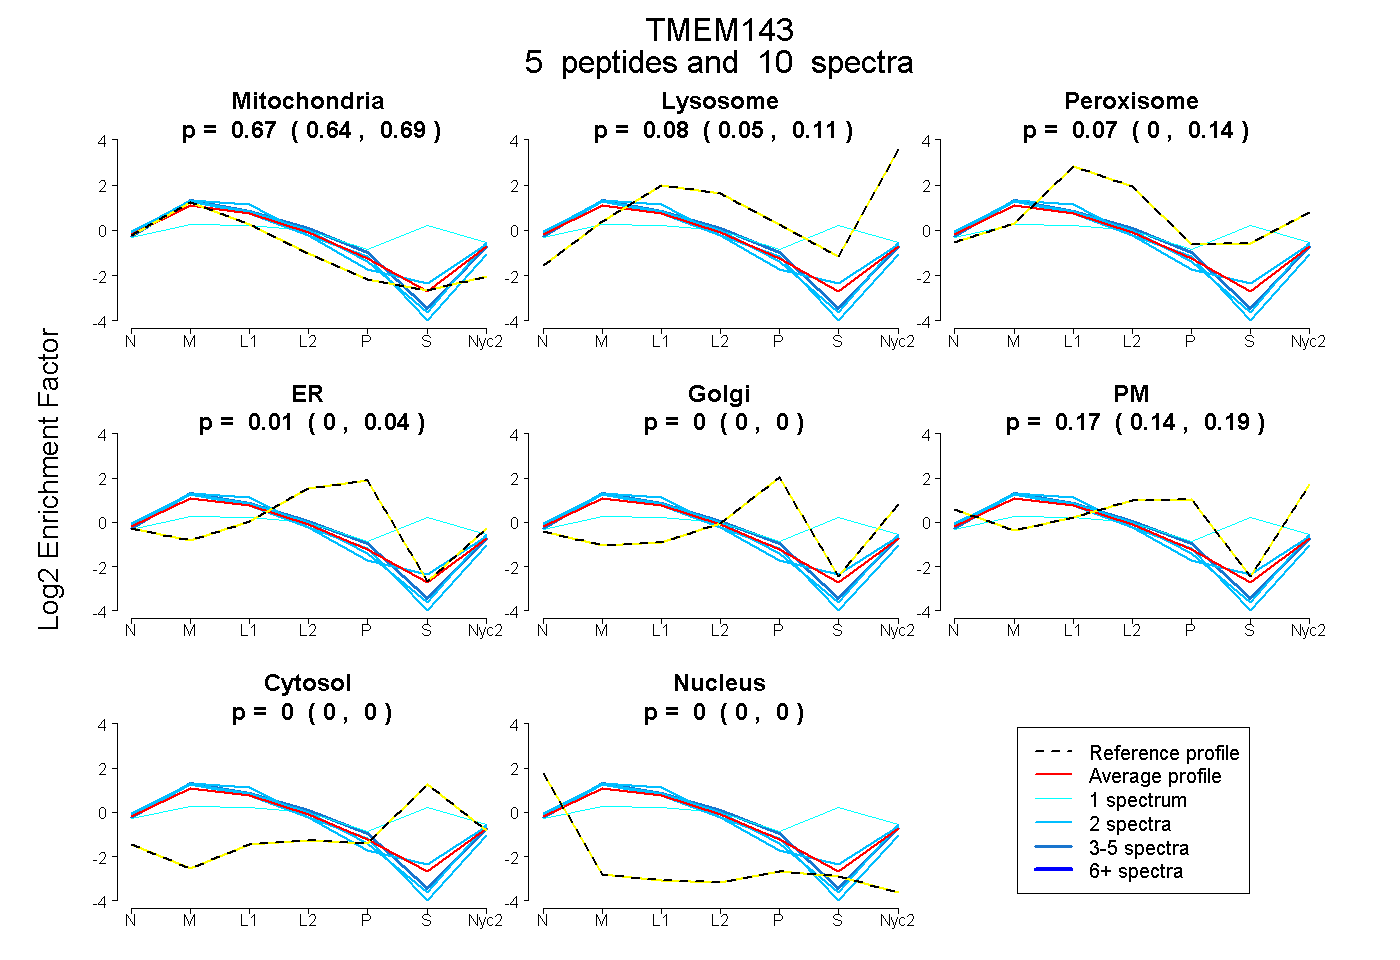
| Expt A |
5 peptides |
10 spectra |
|
0.666 0.637 | 0.690 |
0.084 0.053 | 0.110 |
0.070 0.000 | 0.135 |
0.009 0.000 | 0.040 |
0.000 0.000 | 0.000 |
0.171 0.138 | 0.190 |
0.000 0.000 | 0.000 |
0.000 0.000 | 0.000 |
| 2 spectra, STSNNSELLSALALR | 0.737 | 0.182 | 0.057 | 0.000 | 0.000 | 0.024 | 0.000 | 0.000 | ||
| 3 spectra, EALLAHSFLGR | 0.661 | 0.110 | 0.000 | 0.110 | 0.000 | 0.119 | 0.000 | 0.000 | ||
| 1 spectrum, ETLDQPSLTDPER | 0.242 | 0.000 | 0.353 | 0.000 | 0.000 | 0.041 | 0.364 | 0.000 | ||
| 2 spectra, FIPFSR | 0.690 | 0.084 | 0.000 | 0.000 | 0.000 | 0.226 | 0.000 | 0.000 | ||
| 2 spectra, EPCNWAQQYR | 0.734 | 0.034 | 0.000 | 0.069 | 0.000 | 0.163 | 0.000 | 0.000 |
| Plot | Lyso | Other | |||||||||||
| Expt C |
15 peptides |
51 spectra |
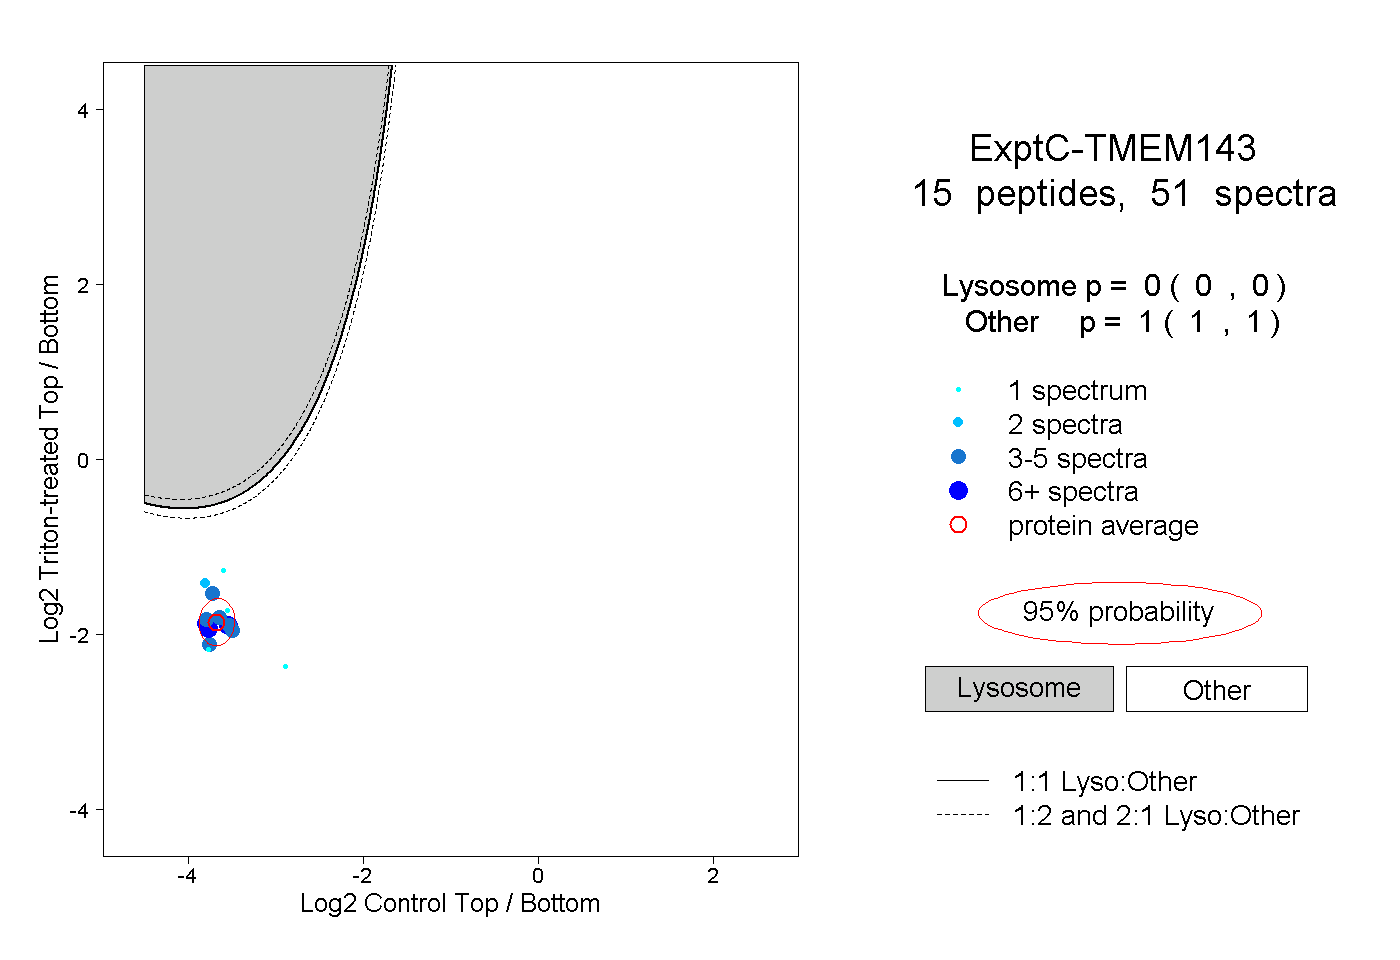 |
0.000 0.000 | 0.000 |
1.000 1.000 | 1.000 |
||||||||
| Plot | Lyso | Other | |||||||||||
| Expt D |
4 peptides |
5 spectra |
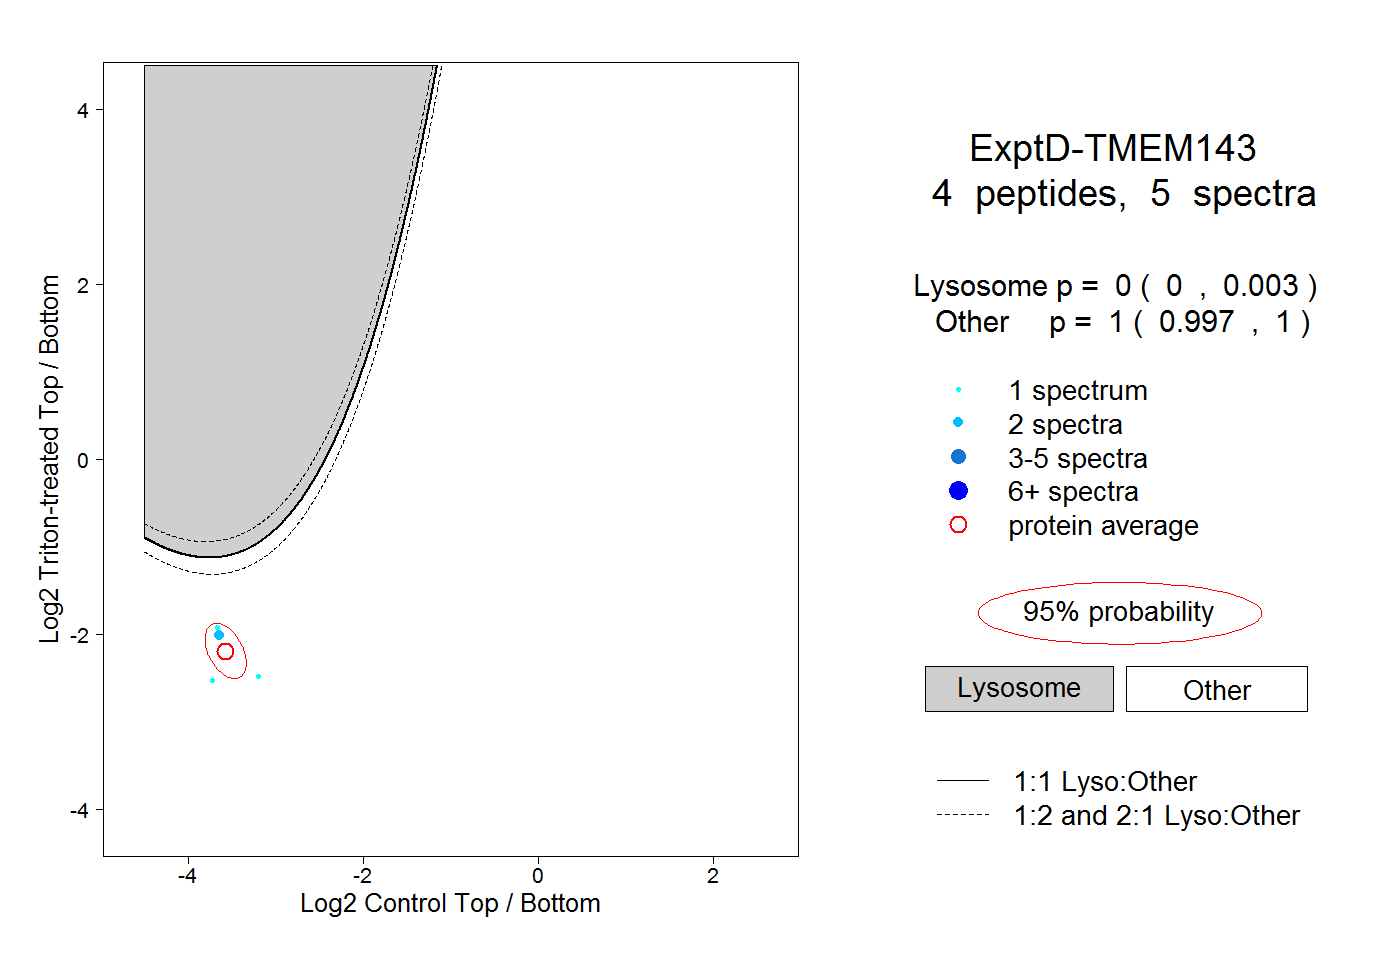 |
0.000 0.000 | 0.003 |
1.000 0.997 | 1.000 |