 4
4peptides
spectra
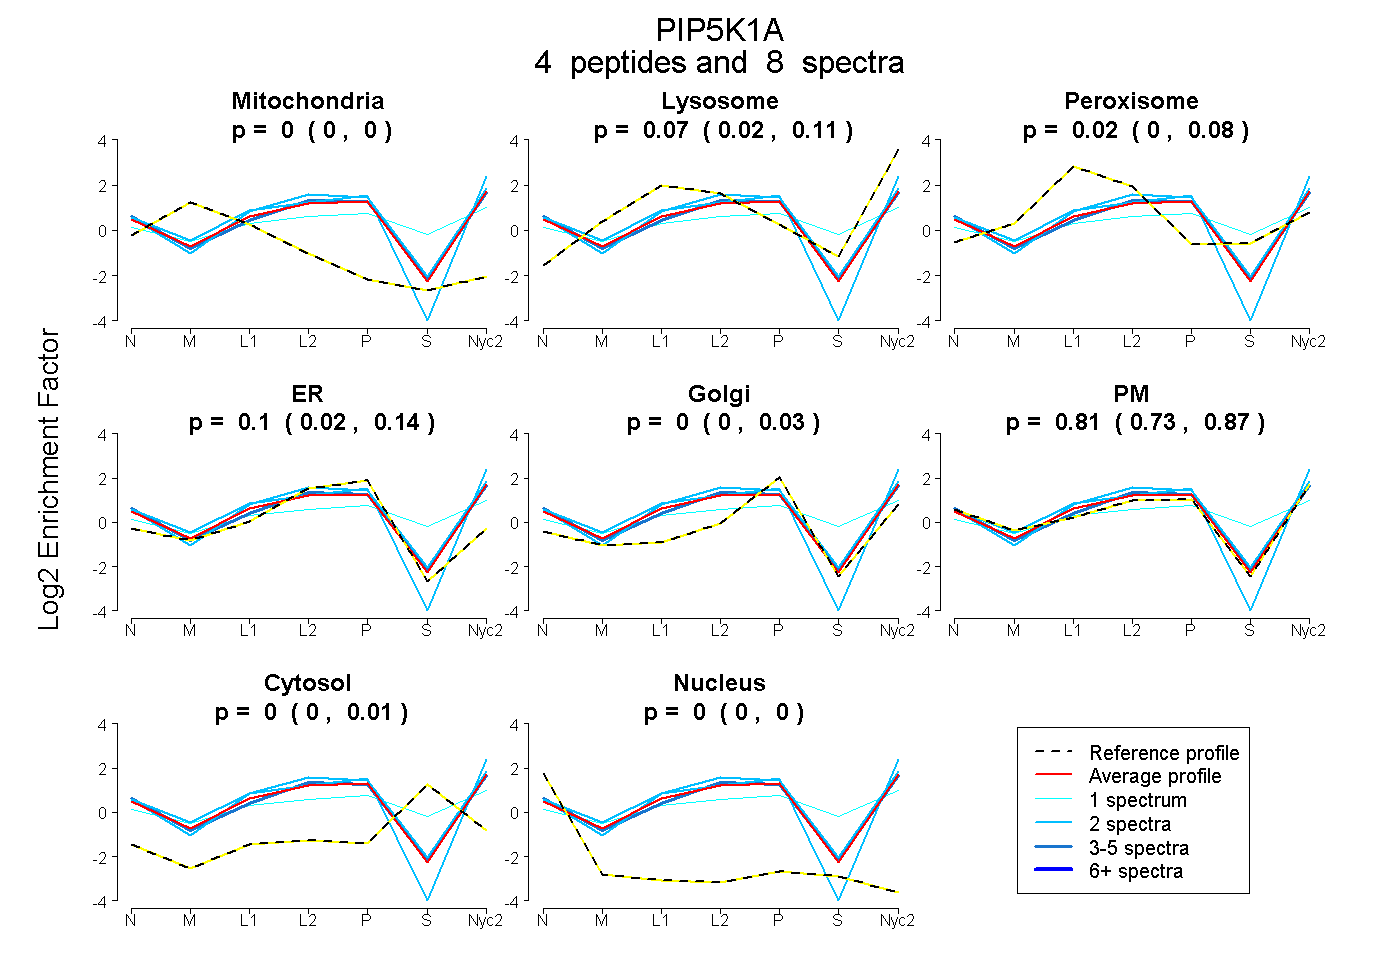
0.000 | 0.000
0.019 | 0.107
0.000 | 0.080
0.019 | 0.142
0.000 | 0.030
0.733 | 0.872
0.000 | 0.013
0.000 | 0.000
1peptide
spectrum
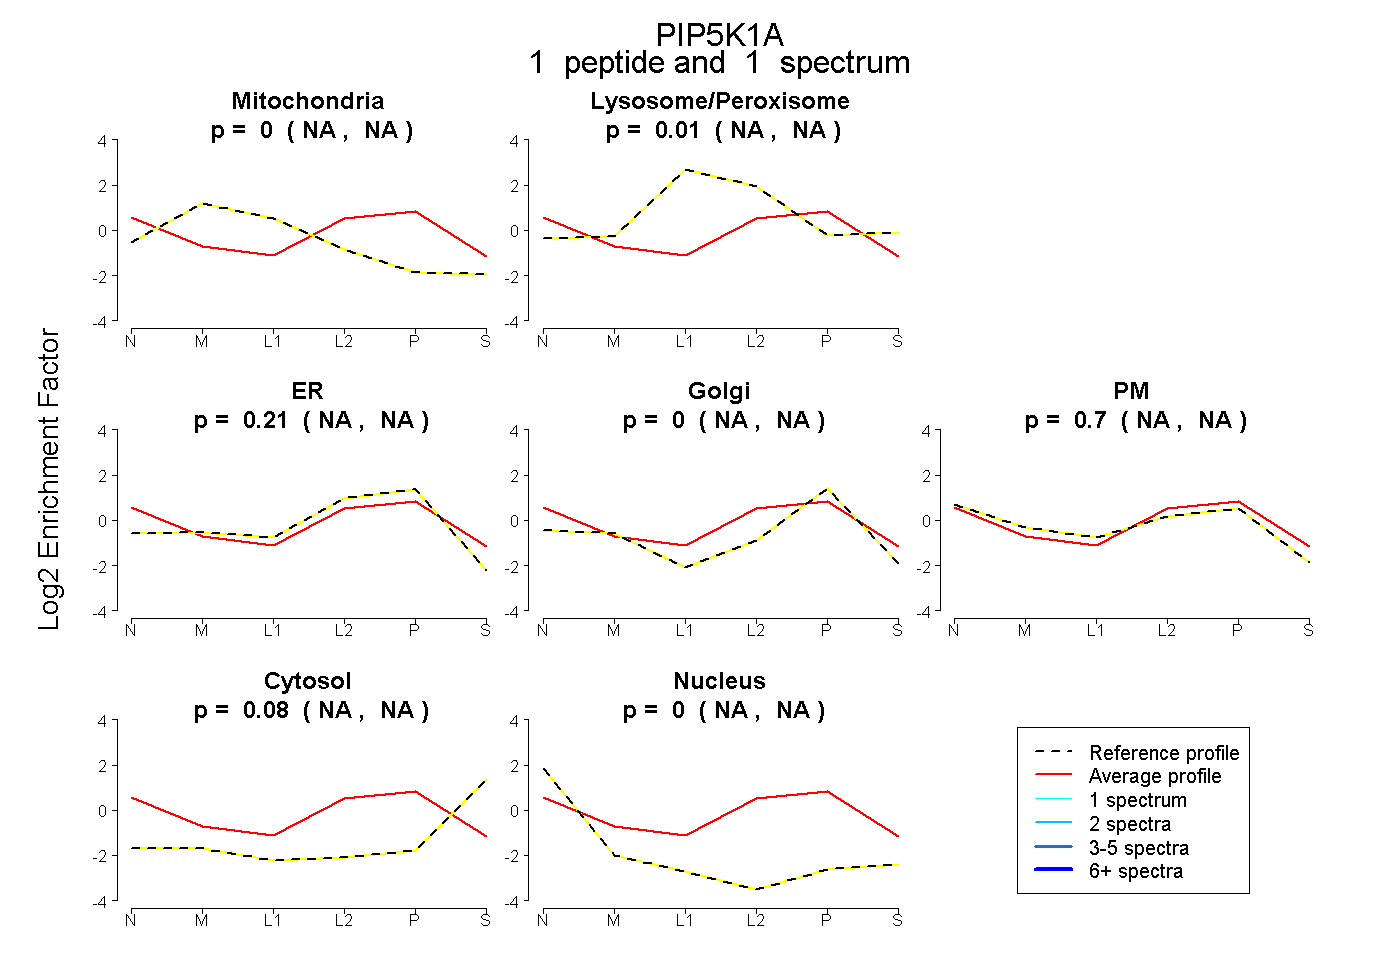
NA | NA
NA | NA
NA | NA
NA | NA
NA | NA
NA | NA
NA | NA
7peptides
spectra
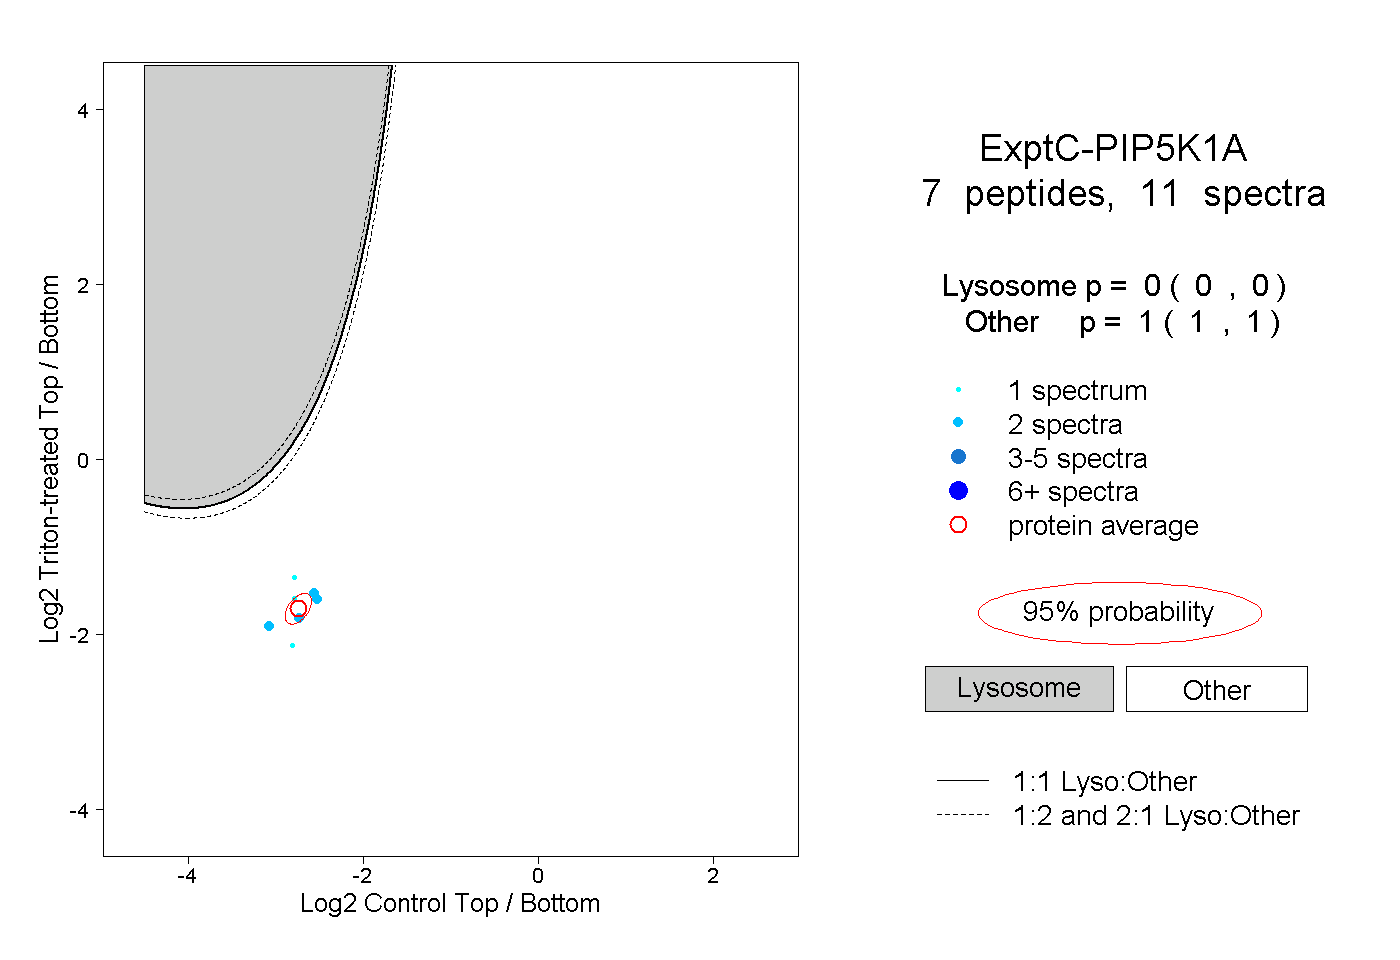
0.000 | 0.000
1.000 | 1.000