 4
4peptides
spectra
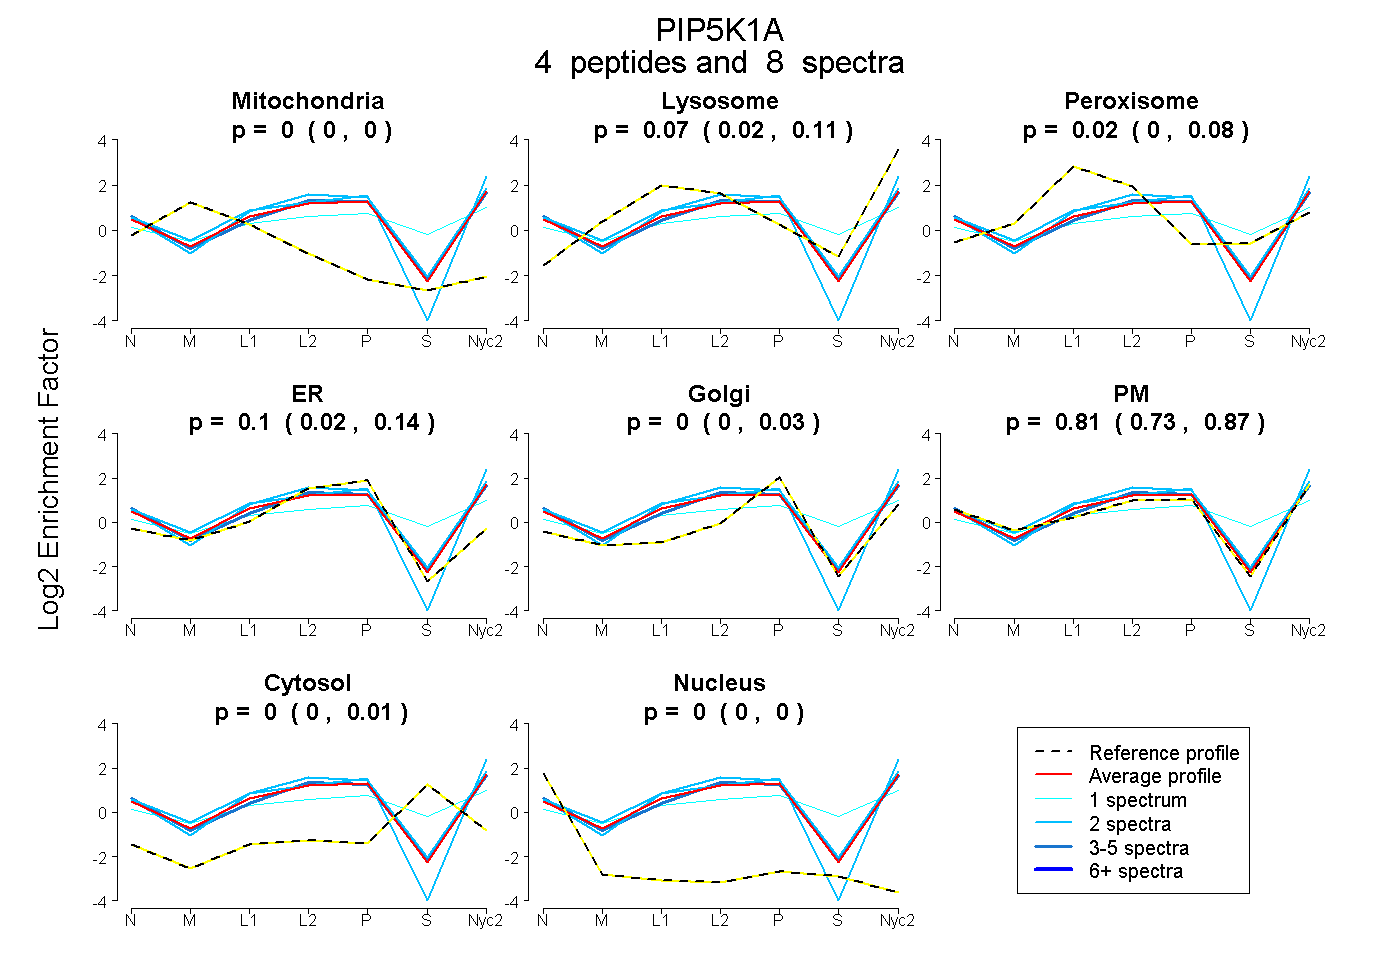
0.000 | 0.000
0.019 | 0.107
0.000 | 0.080
0.019 | 0.142
0.000 | 0.030
0.733 | 0.872
0.000 | 0.013
0.000 | 0.000
| Plot | Mito | Lyso | Perox | ER | Golgi | PM | Cytosol | Nucleus | |||||
| Expt A |
4 peptides |
8 spectra |
|
0.000 0.000 | 0.000 |
0.073 0.019 | 0.107 |
0.019 0.000 | 0.080 |
0.098 0.019 | 0.142 |
0.000 0.000 | 0.030 |
0.810 0.733 | 0.872 |
0.000 0.000 | 0.013 |
0.000 0.000 | 0.000 |
| 1 spectrum, GGTVETEDHMGGIPAR | 0.000 | 0.037 | 0.225 | 0.000 | 0.067 | 0.426 | 0.246 | 0.000 | ||
| 2 spectra, LLPGYYMNLNQNPR | 0.000 | 0.010 | 0.000 | 0.000 | 0.000 | 0.990 | 0.000 | 0.000 | ||
| 2 spectra, LDVAESELTH | 0.000 | 0.108 | 0.036 | 0.141 | 0.000 | 0.716 | 0.000 | 0.000 | ||
| 3 spectra, IVVMNNLLPR | 0.000 | 0.024 | 0.025 | 0.090 | 0.000 | 0.861 | 0.000 | 0.000 |
| Plot | Mito | Lyso or Perox | ER | Golgi | PM | Cytosol | Nucleus | ||||||
| Expt B |
1 peptide |
1 spectrum |
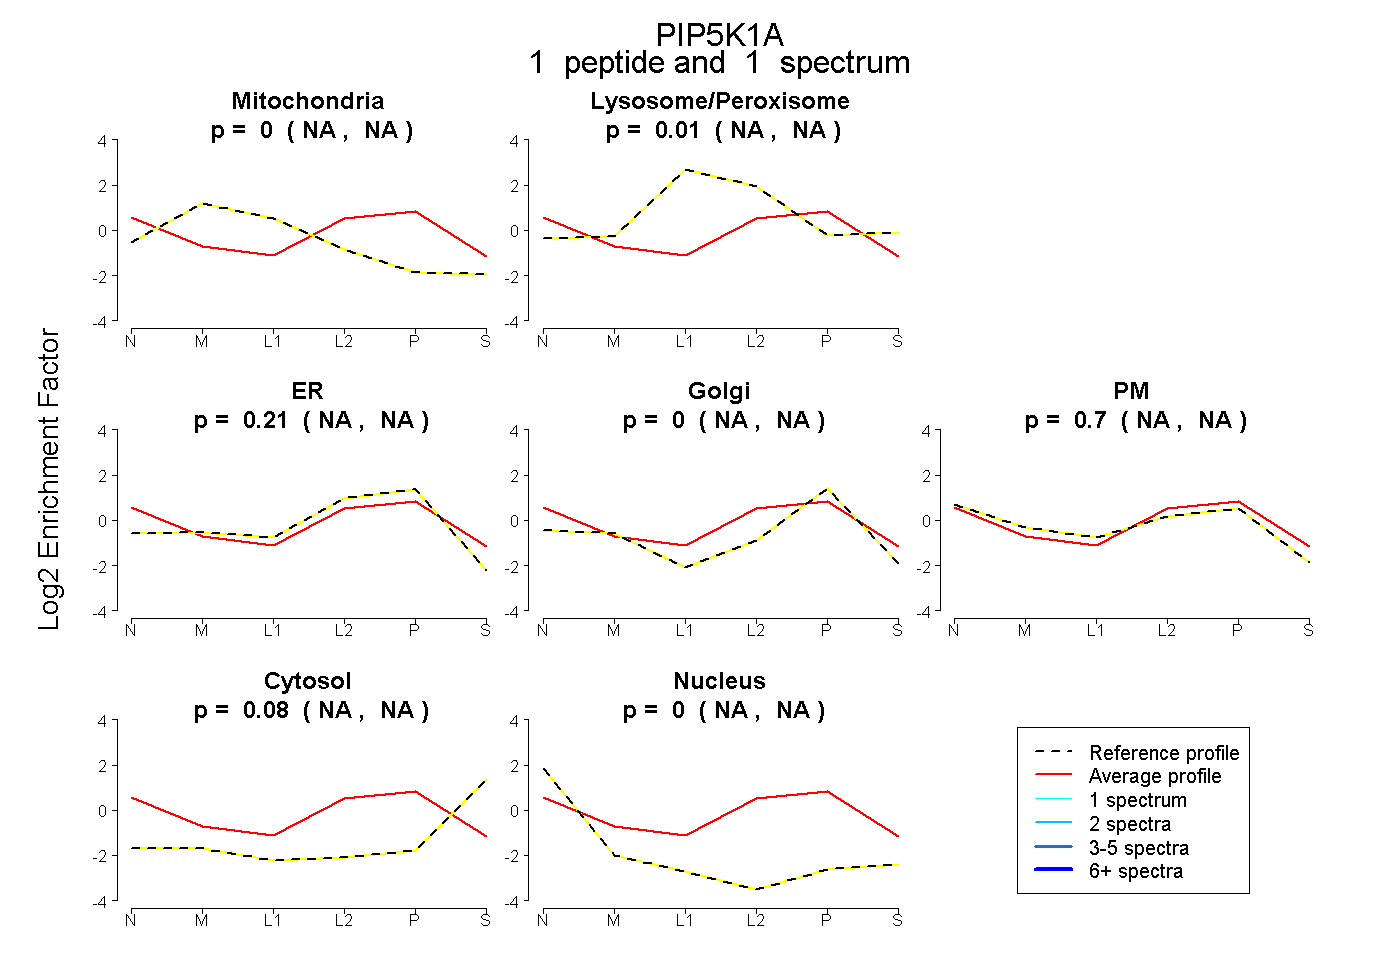 |
0.000 NA | NA |
0.015 NA | NA |
0.208 NA | NA |
0.000 NA | NA |
0.696 NA | NA |
0.081 NA | NA |
0.000 NA | NA |
|||
| Plot | Lyso | Other | |||||||||||
| Expt C |
7 peptides |
11 spectra |
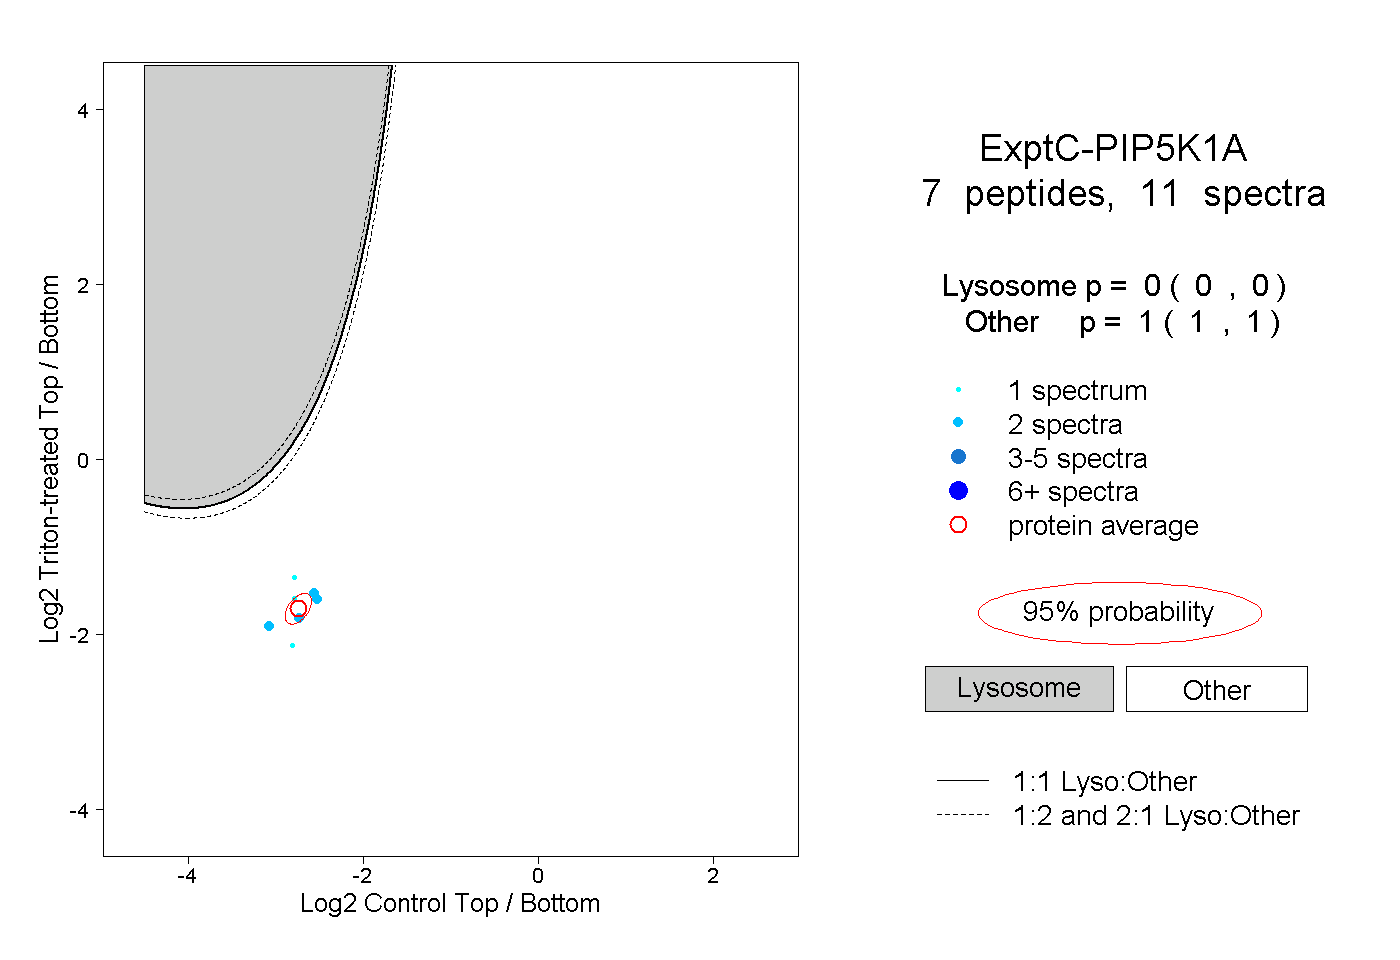 |
0.000 0.000 | 0.000 |
1.000 1.000 | 1.000 |