 10
10peptides
spectra
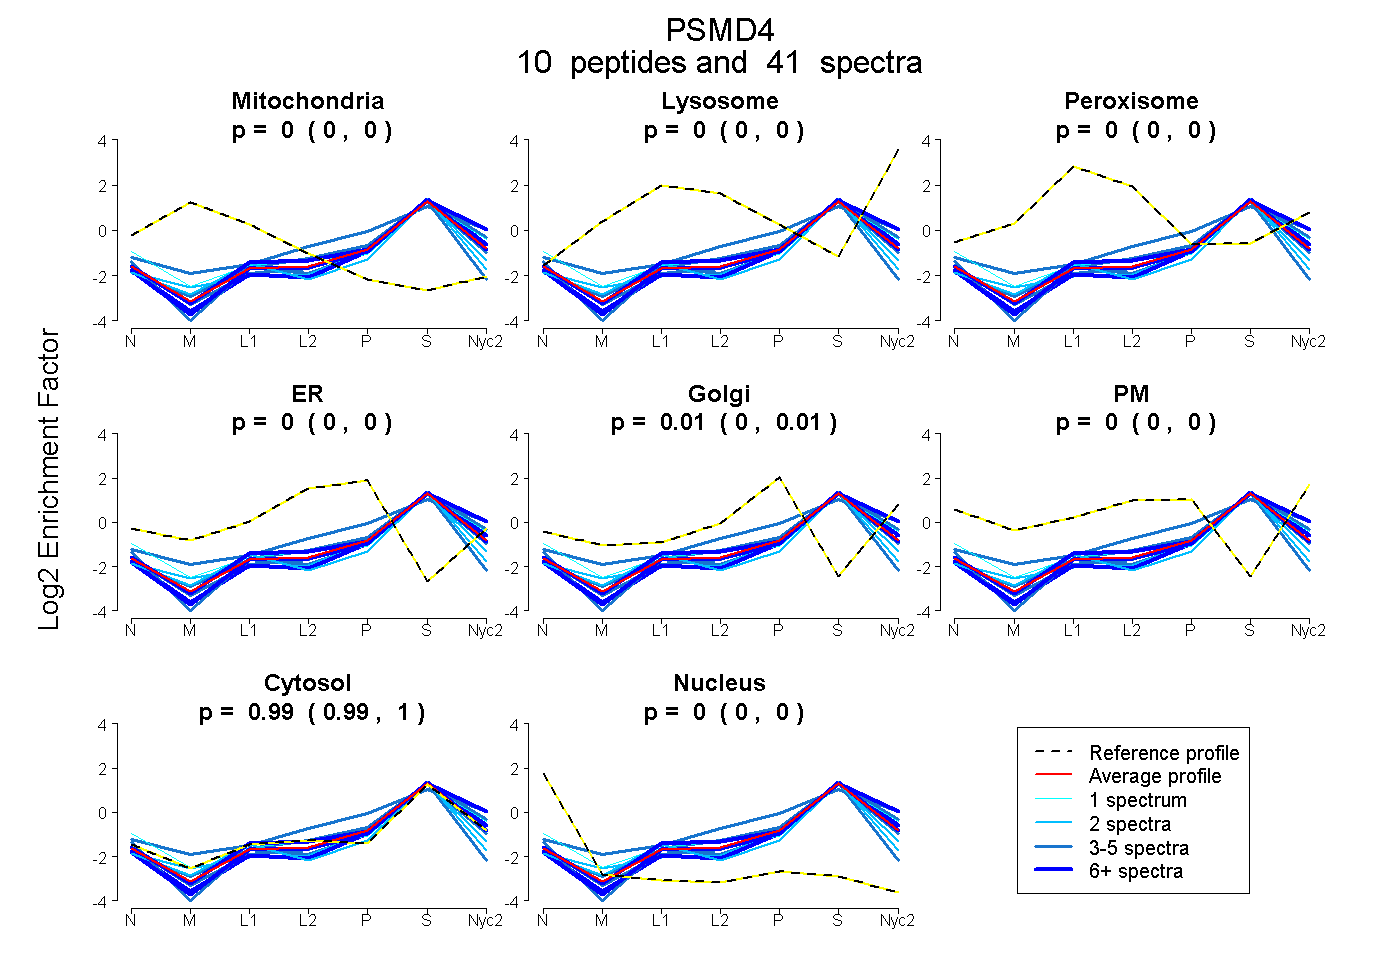
0.000 | 0.000
0.000 | 0.000
0.000 | 0.000
0.000 | 0.000
0.000 | 0.011
0.000 | 0.000
0.989 | 1.000
0.000 | 0.000
3peptides
spectra
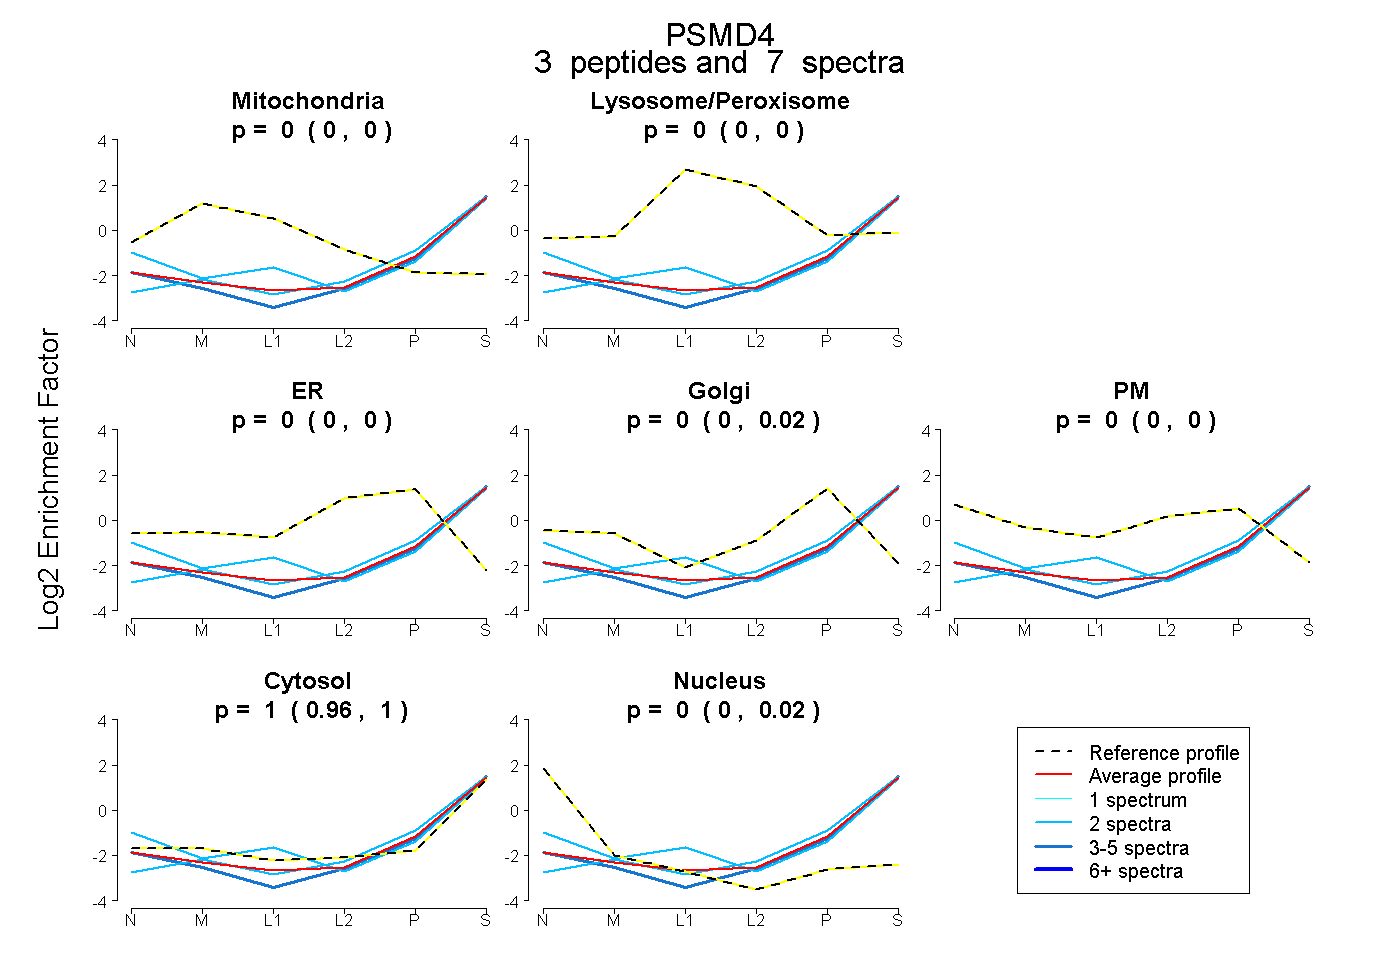
0.000 | 0.000
0.000 | 0.000
0.000 | 0.000
0.000 | 0.022
0.000 | 0.000
0.960 | 1.000
0.000 | 0.021
8peptides
spectra
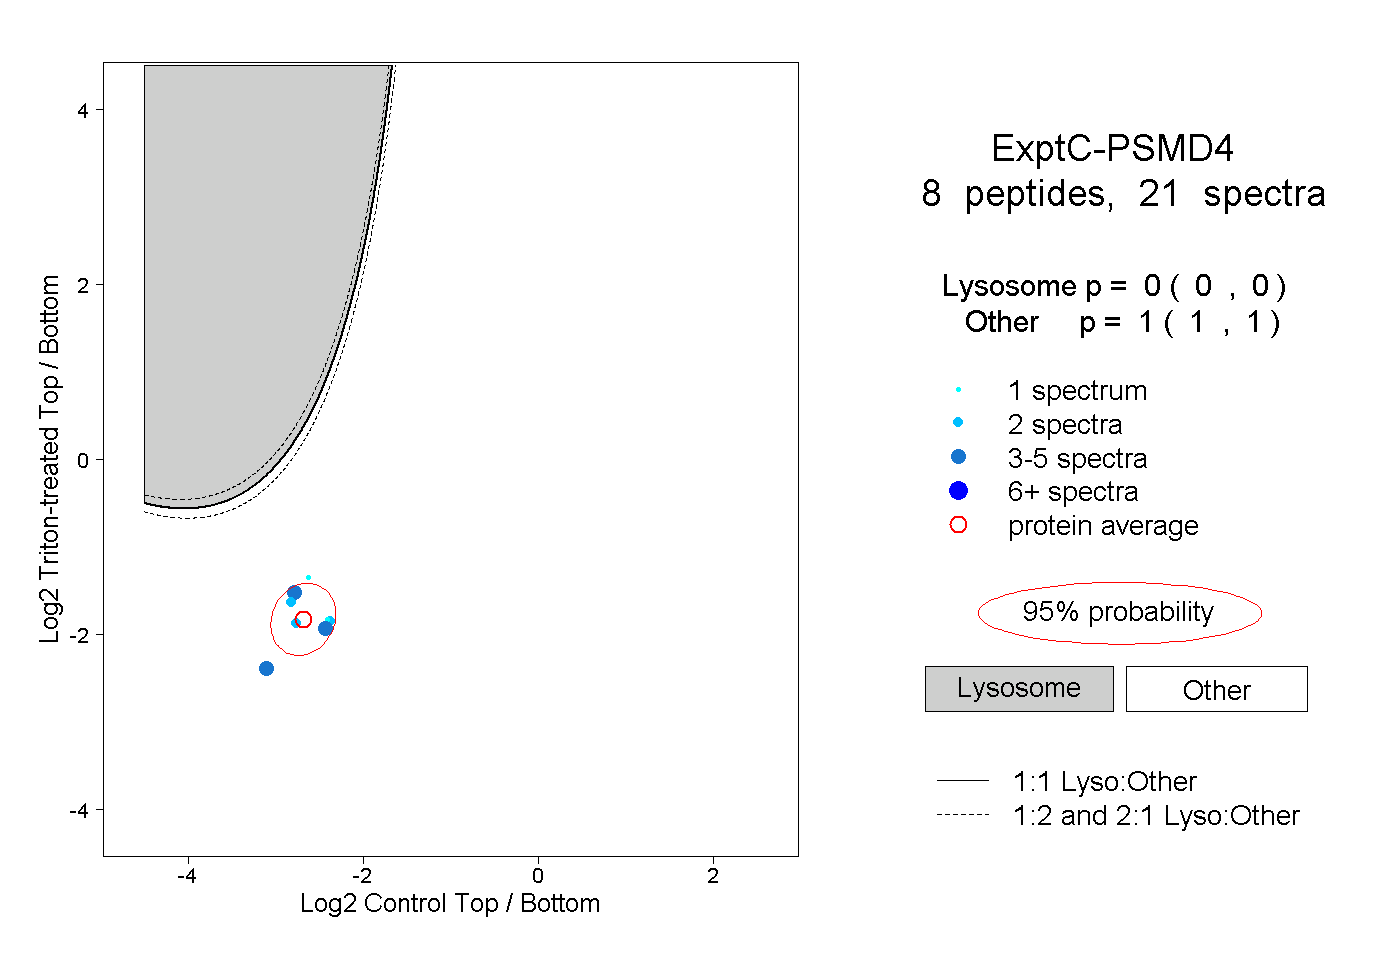
0.000 | 0.000
1.000 | 1.000