 10
10peptides
spectra
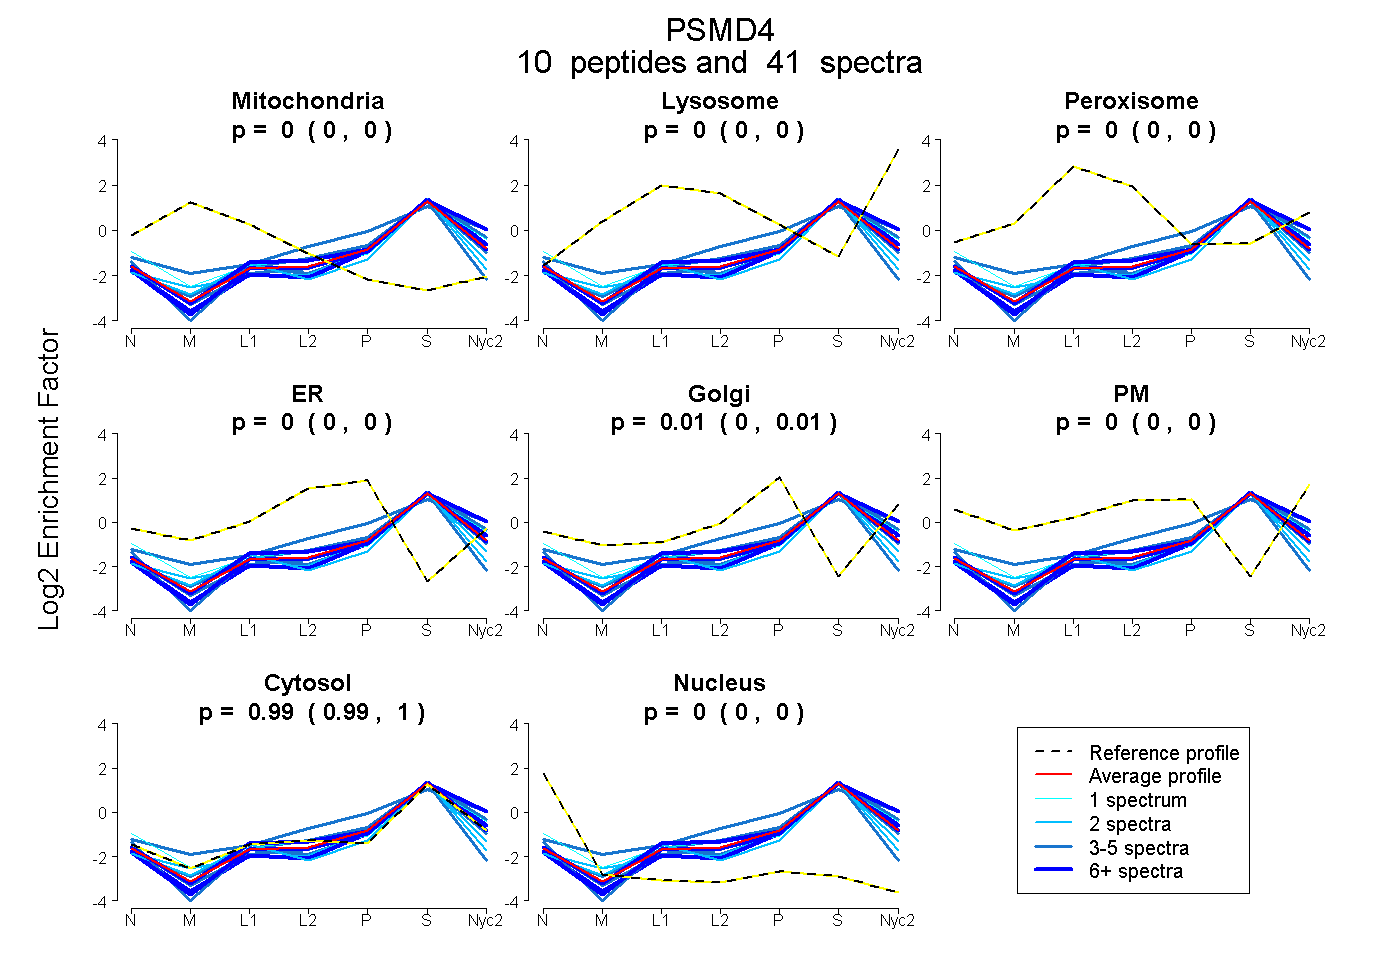
0.000 | 0.000
0.000 | 0.000
0.000 | 0.000
0.000 | 0.000
0.000 | 0.011
0.000 | 0.000
0.989 | 1.000
0.000 | 0.000
| Plot | Mito | Lyso | Perox | ER | Golgi | PM | Cytosol | Nucleus | |||||
| Expt A |
10 peptides |
41 spectra |
|
0.000 0.000 | 0.000 |
0.000 0.000 | 0.000 |
0.000 0.000 | 0.000 |
0.000 0.000 | 0.000 |
0.005 0.000 | 0.011 |
0.000 0.000 | 0.000 |
0.995 0.989 | 1.000 |
0.000 0.000 | 0.000 |
| 2 spectra, VLESTMVCVDNSEYMR | 0.000 | 0.000 | 0.000 | 0.000 | 0.000 | 0.000 | 0.944 | 0.056 | ||
| 7 spectra, VAHLALK | 0.000 | 0.000 | 0.000 | 0.000 | 0.000 | 0.000 | 1.000 | 0.000 | ||
| 3 spectra, NAMGSLASQATK | 0.000 | 0.000 | 0.000 | 0.000 | 0.028 | 0.000 | 0.972 | 0.000 | ||
| 3 spectra, DSDDALLK | 0.000 | 0.000 | 0.000 | 0.000 | 0.000 | 0.000 | 1.000 | 0.000 | ||
| 2 spectra, LQAQQDAVNIVCHSK | 0.000 | 0.000 | 0.000 | 0.000 | 0.000 | 0.000 | 0.967 | 0.033 | ||
| 5 spectra, ITFCTGIR | 0.000 | 0.000 | 0.000 | 0.000 | 0.000 | 0.000 | 0.905 | 0.095 | ||
| 8 spectra, VSMEEQR | 0.000 | 0.030 | 0.000 | 0.000 | 0.027 | 0.000 | 0.943 | 0.000 | ||
| 6 spectra, MTISQQEFGR | 0.000 | 0.000 | 0.000 | 0.000 | 0.000 | 0.000 | 1.000 | 0.000 | ||
| 1 spectrum, NGDFLPTR | 0.000 | 0.000 | 0.000 | 0.000 | 0.025 | 0.043 | 0.929 | 0.003 | ||
| 4 spectra, LHTVQPK | 0.000 | 0.059 | 0.000 | 0.000 | 0.204 | 0.000 | 0.737 | 0.000 |
| Plot | Mito | Lyso or Perox | ER | Golgi | PM | Cytosol | Nucleus | ||||||
| Expt B |
3 peptides |
7 spectra |
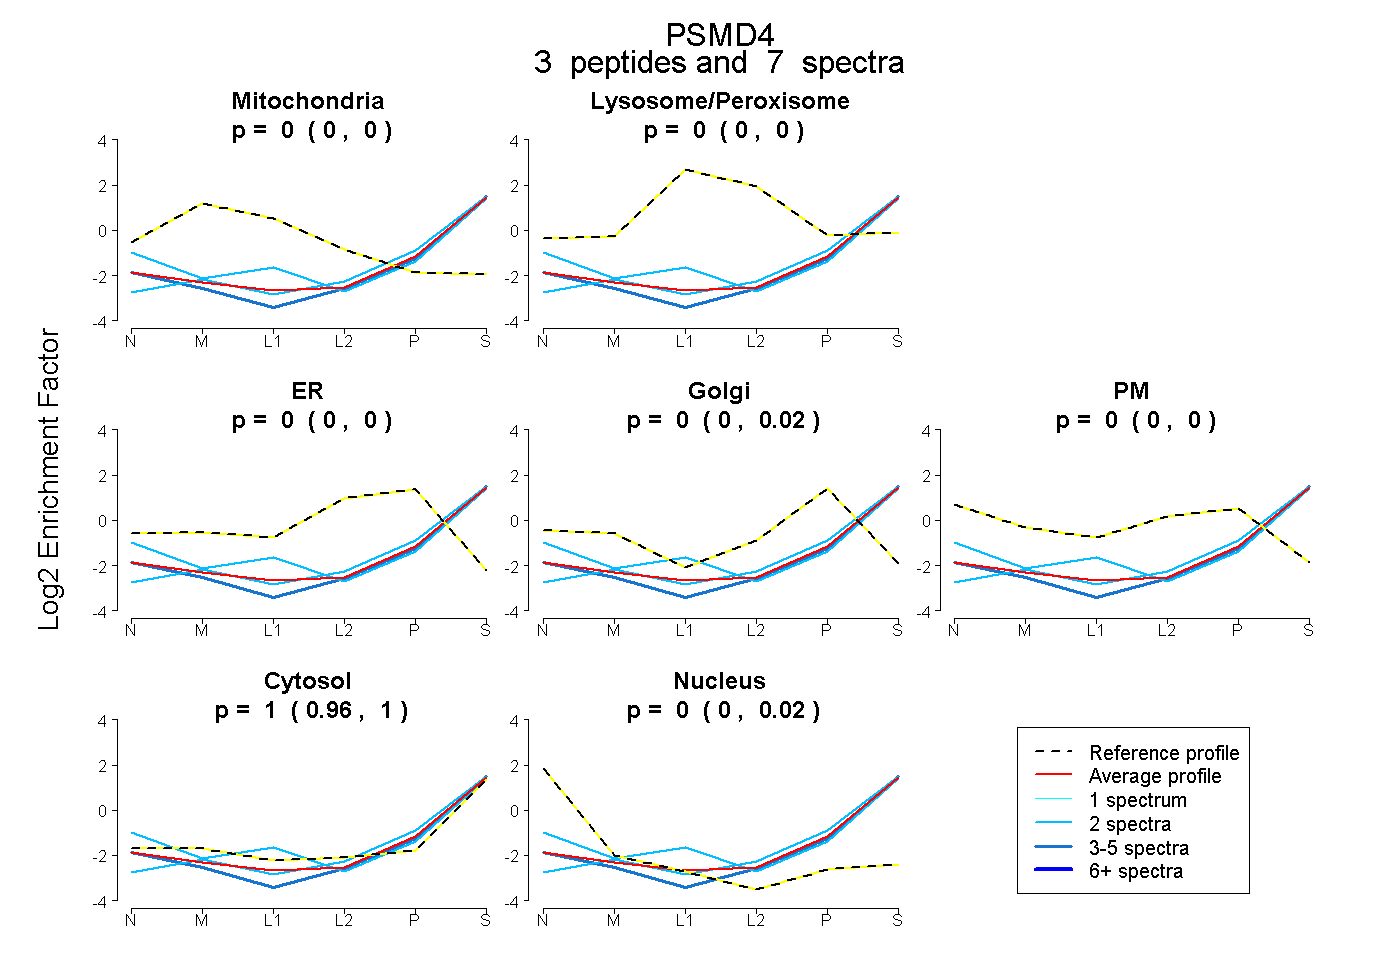 |
0.000 0.000 | 0.000 |
0.000 0.000 | 0.000 |
0.000 0.000 | 0.000 |
0.004 0.000 | 0.022 |
0.000 0.000 | 0.000 |
0.996 0.960 | 1.000 |
0.000 0.000 | 0.021 |
|||
| Plot | Lyso | Other | |||||||||||
| Expt C |
8 peptides |
21 spectra |
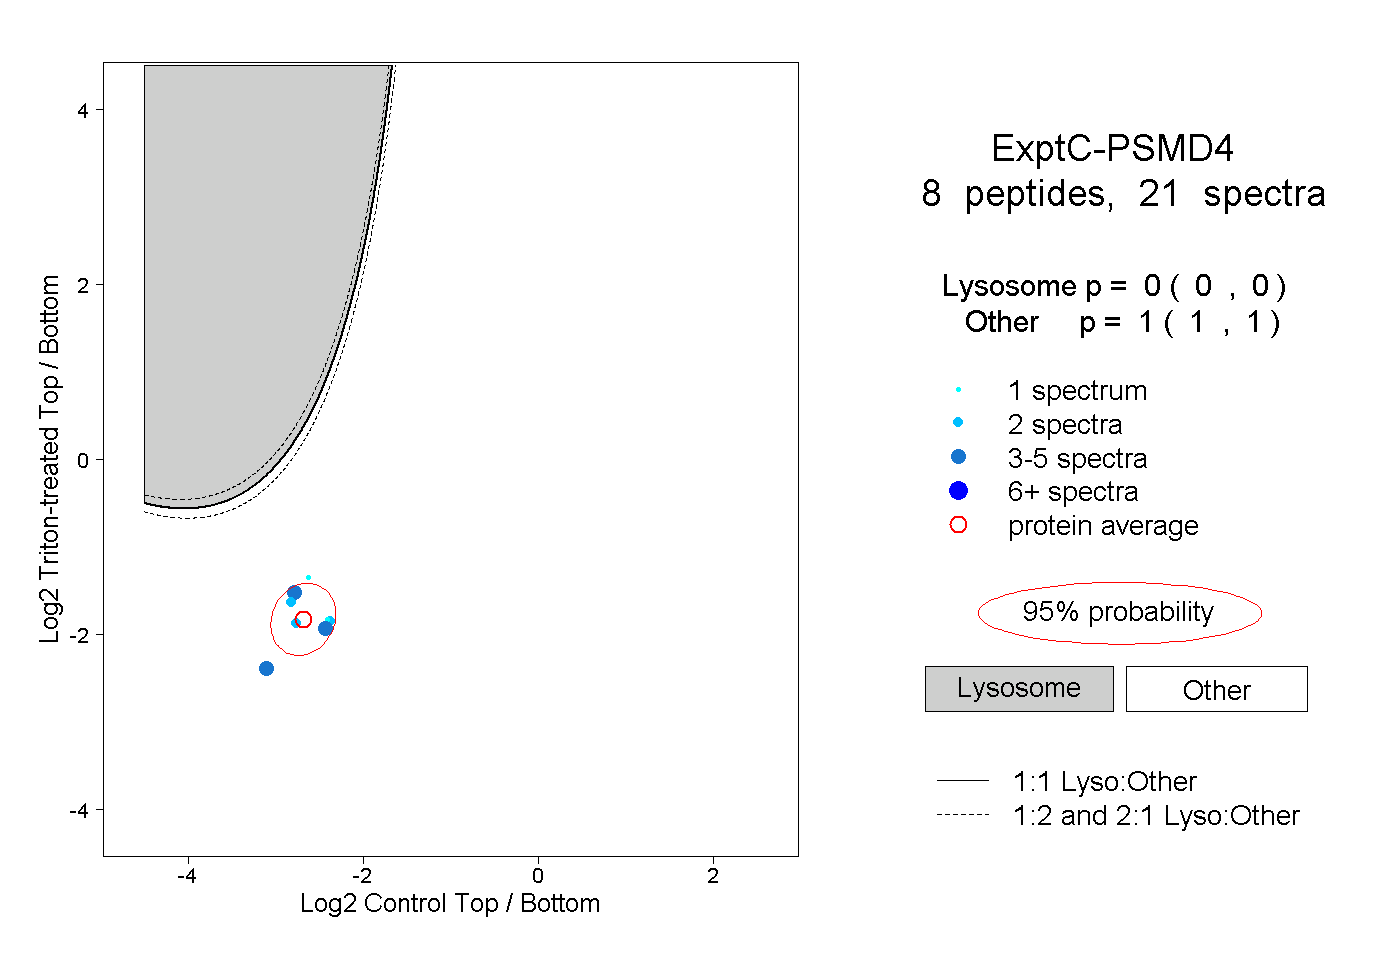 |
0.000 0.000 | 0.000 |
1.000 1.000 | 1.000 |