 8
8peptides
spectra
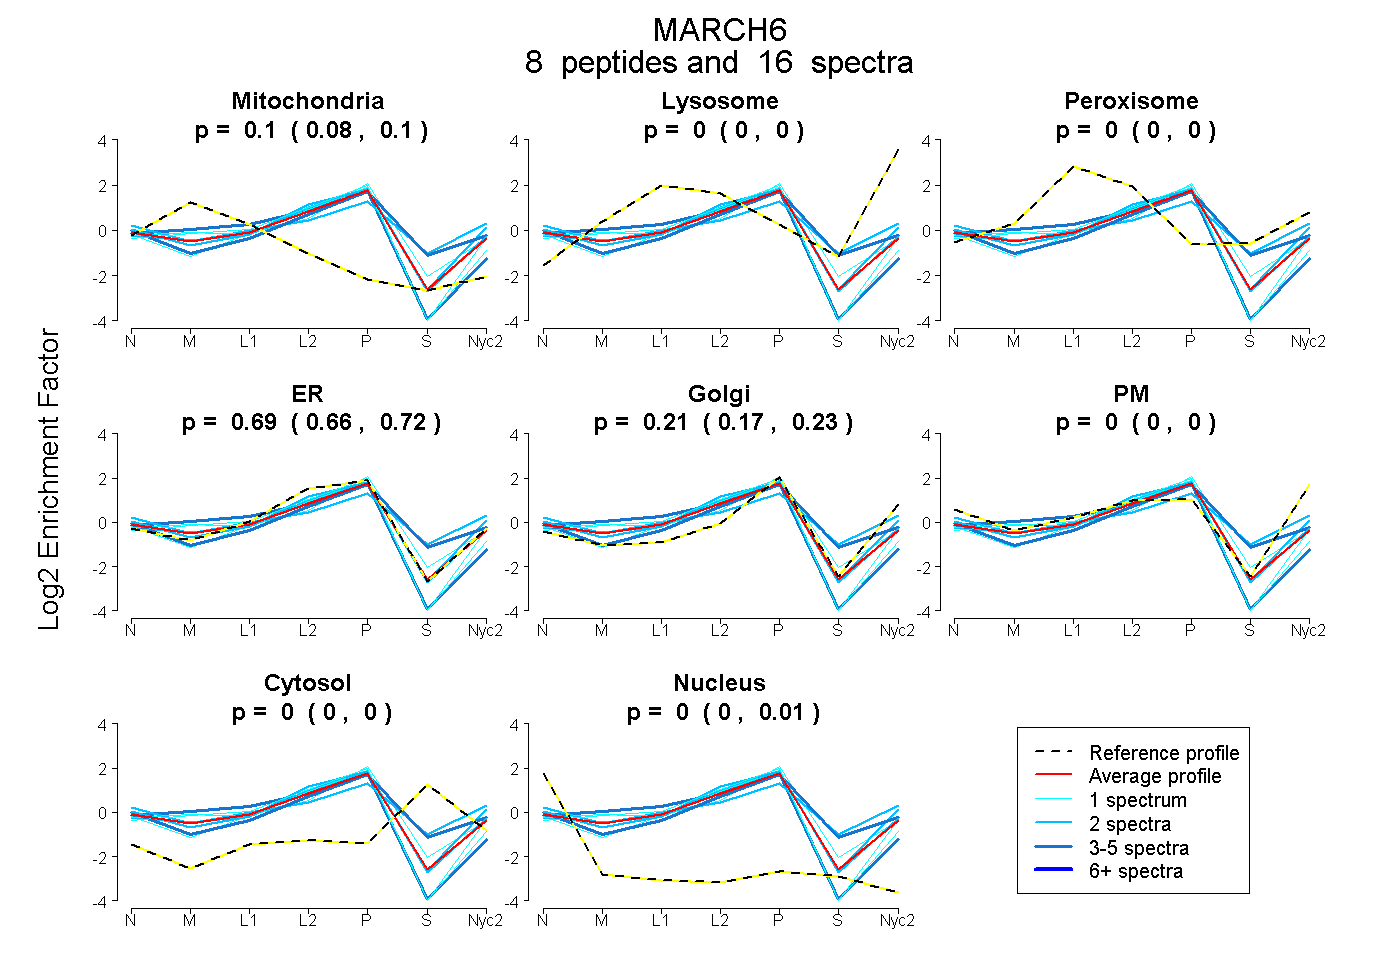
0.080 | 0.104
0.000 | 0.000
0.000 | 0.000
0.665 | 0.725
0.169 | 0.233
0.000 | 0.000
0.000 | 0.000
0.000 | 0.012
2peptides
spectra
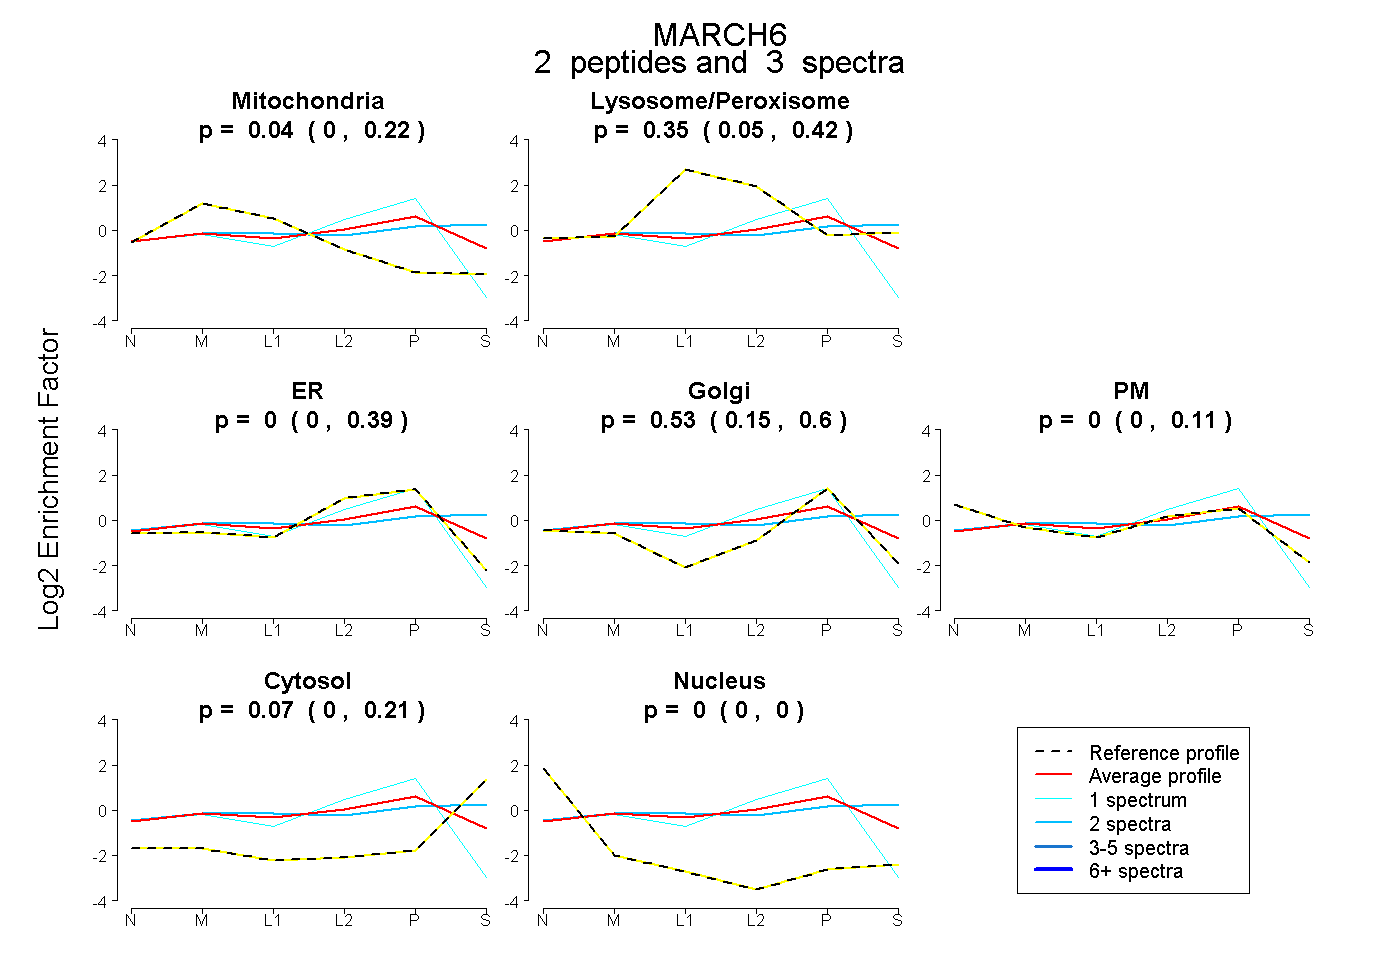
0.000 | 0.220
0.051 | 0.422
0.000 | 0.391
0.146 | 0.600
0.000 | 0.109
0.000 | 0.210
0.000 | 0.000
4peptides
spectra

0.000 | 0.000
1.000 | 1.000
1peptide
spectrum
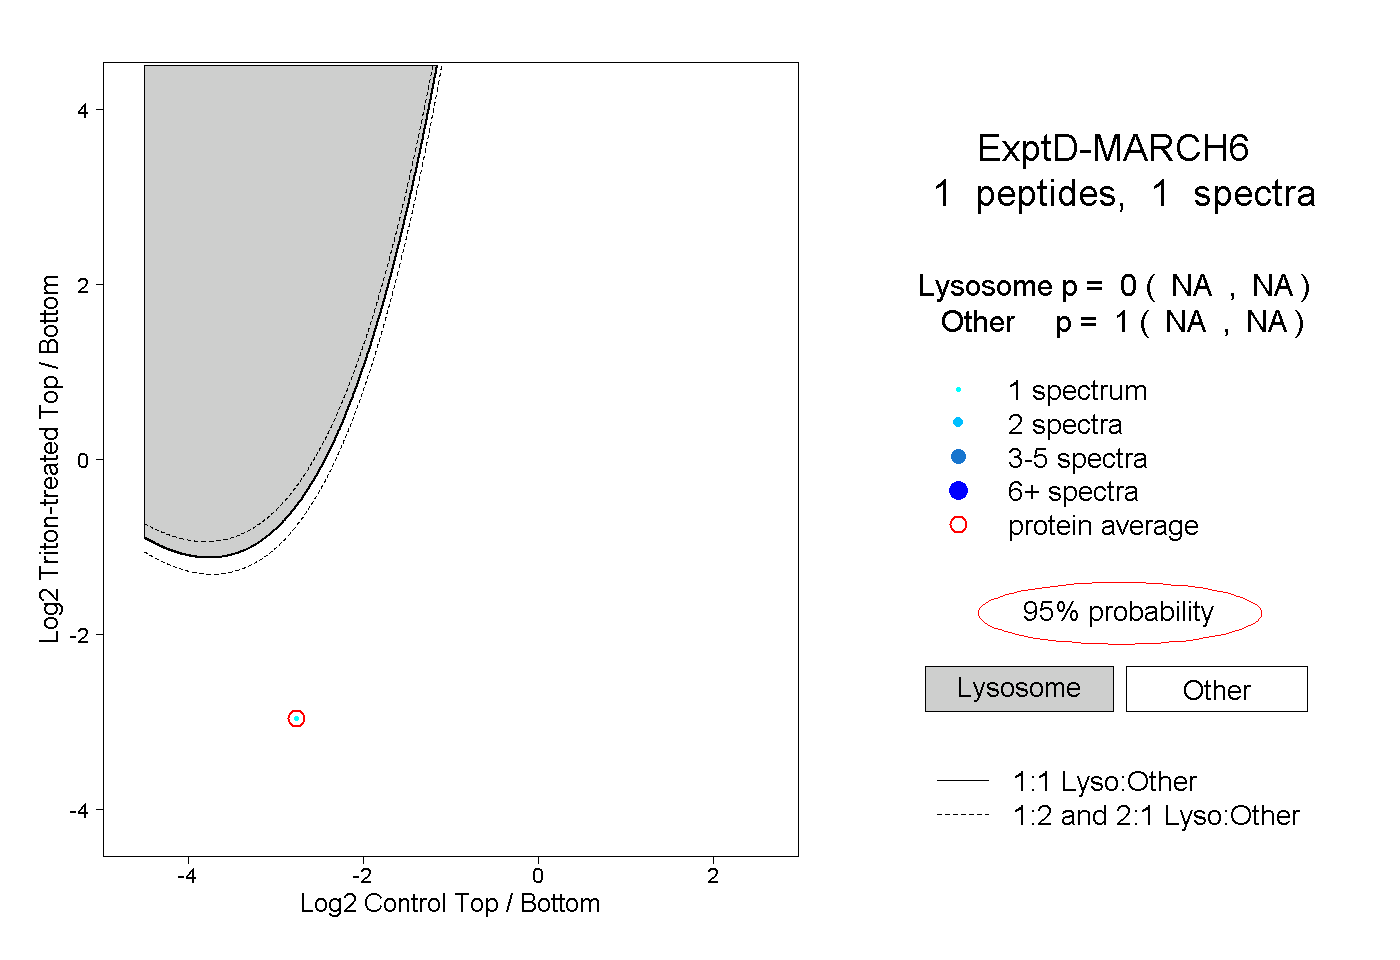
NA | NA
NA | NA