 8
8peptides
spectra
0.080 | 0.104
0.000 | 0.000
0.000 | 0.000
0.665 | 0.725
0.169 | 0.233
0.000 | 0.000
0.000 | 0.000
0.000 | 0.012
| Plot | Mito | Lyso | Perox | ER | Golgi | PM | Cytosol | Nucleus | |||||
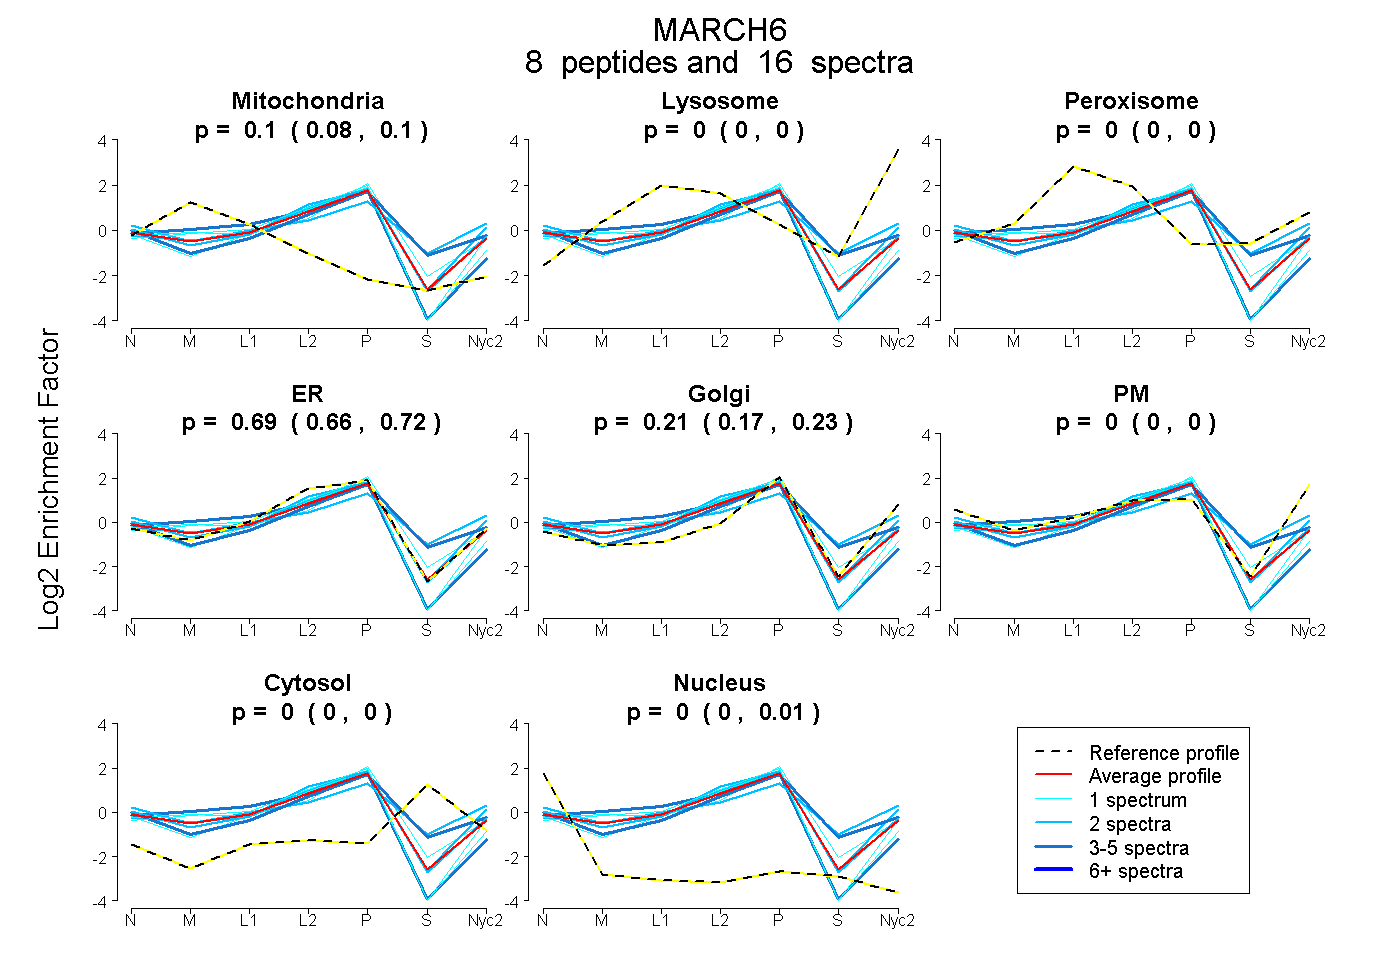
| Expt A |
8 peptides |
16 spectra |
|
0.095 0.080 | 0.104 |
0.000 0.000 | 0.000 |
0.000 0.000 | 0.000 |
0.695 0.665 | 0.725 |
0.207 0.169 | 0.233 |
0.000 0.000 | 0.000 |
0.000 0.000 | 0.000 |
0.002 0.000 | 0.012 |
| 2 spectra, QGPSTPPPVSSQE | 0.000 | 0.000 | 0.157 | 0.184 | 0.280 | 0.218 | 0.161 | 0.000 | ||
| 2 spectra, YLVAGGR | 0.009 | 0.000 | 0.000 | 0.821 | 0.077 | 0.057 | 0.000 | 0.036 | ||
| 1 spectrum, NIDLHYIIR | 0.000 | 0.000 | 0.000 | 0.625 | 0.281 | 0.000 | 0.079 | 0.015 | ||
| 1 spectrum, TVIEQVYANGIR | 0.098 | 0.000 | 0.000 | 0.779 | 0.124 | 0.000 | 0.000 | 0.000 | ||
| 4 spectra, RPLNFPLR | 0.000 | 0.000 | 0.018 | 0.597 | 0.167 | 0.016 | 0.203 | 0.000 | ||
| 1 spectrum, YLVGQR | 0.114 | 0.000 | 0.000 | 0.886 | 0.000 | 0.000 | 0.000 | 0.000 | ||
| 3 spectra, AAEELTWER | 0.193 | 0.000 | 0.000 | 0.807 | 0.000 | 0.000 | 0.000 | 0.000 | ||
| 2 spectra, NLNDPDFNPVQEMIHLPIYR | 0.041 | 0.000 | 0.000 | 0.622 | 0.243 | 0.094 | 0.000 | 0.000 |
| Plot | Mito | Lyso or Perox | ER | Golgi | PM | Cytosol | Nucleus | ||||||
| Expt B |
2 peptides |
3 spectra |
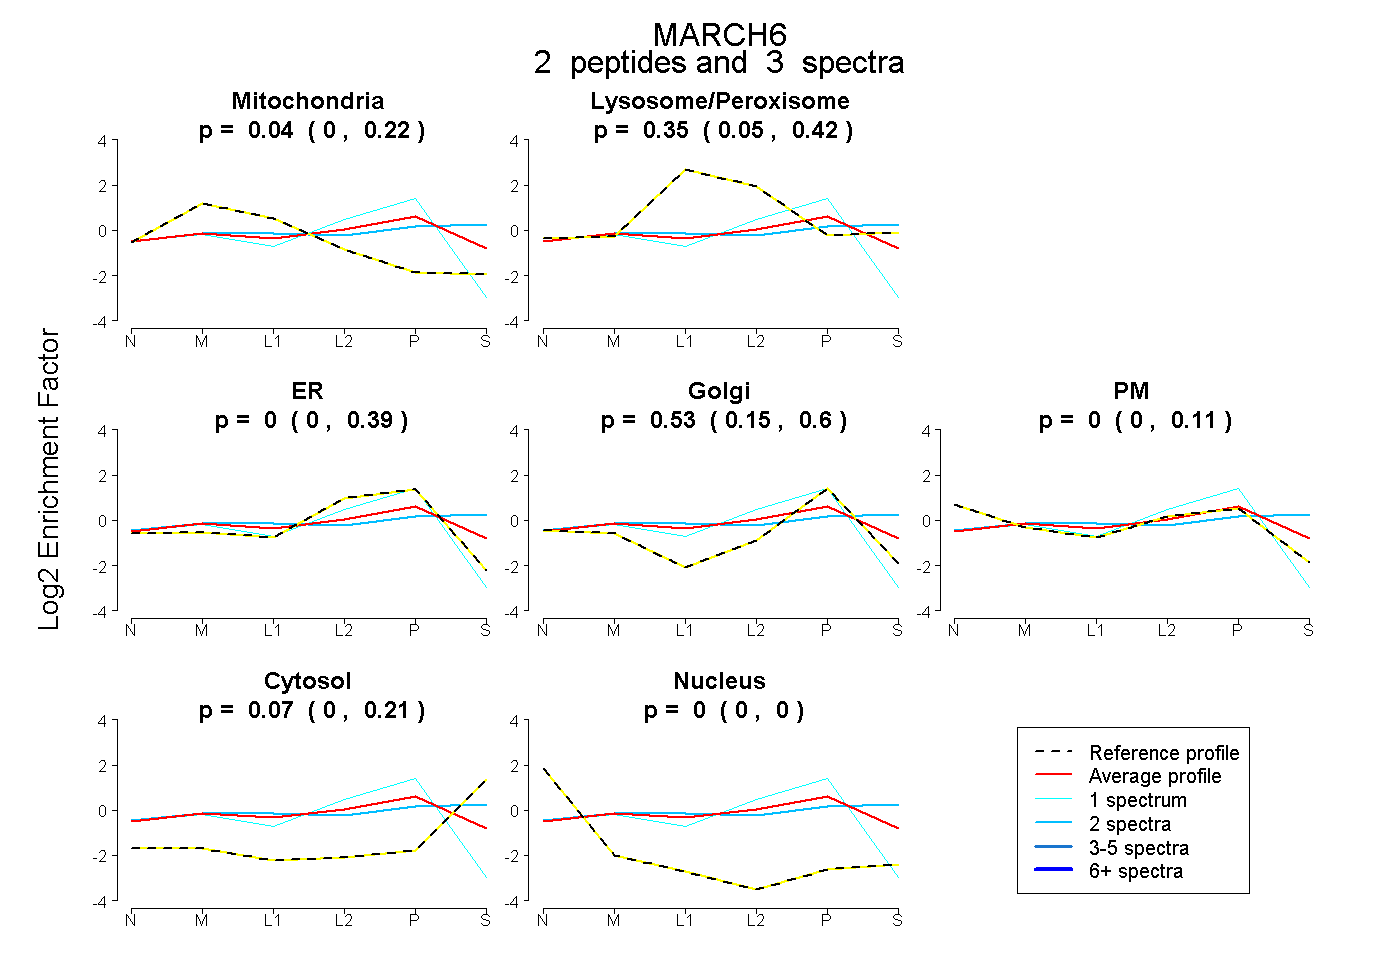 |
0.045 0.000 | 0.220 |
0.354 0.051 | 0.422 |
0.000 0.000 | 0.391 |
0.533 0.146 | 0.600 |
0.000 0.000 | 0.109 |
0.069 0.000 | 0.210 |
0.000 0.000 | 0.000 |
|||
| Plot | Lyso | Other | |||||||||||
| Expt C |
4 peptides |
9 spectra |
 |
0.000 0.000 | 0.000 |
1.000 1.000 | 1.000 |
||||||||
| Plot | Lyso | Other | |||||||||||
| Expt D |
1 peptide |
1 spectrum |
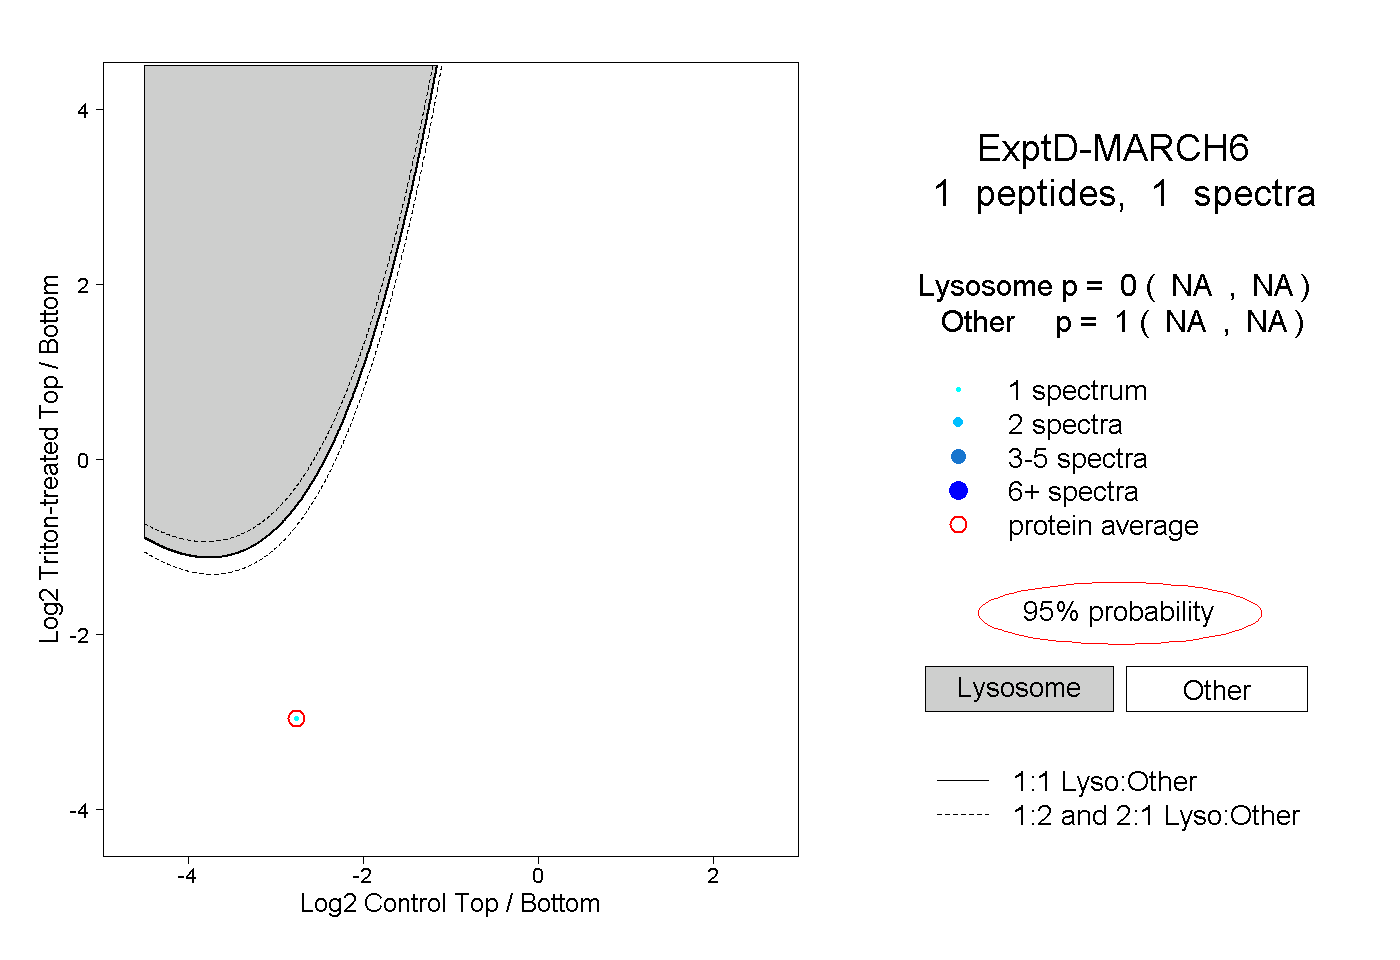 |
0.000 NA | NA |
1.000 NA | NA |