 7
7peptides
spectra
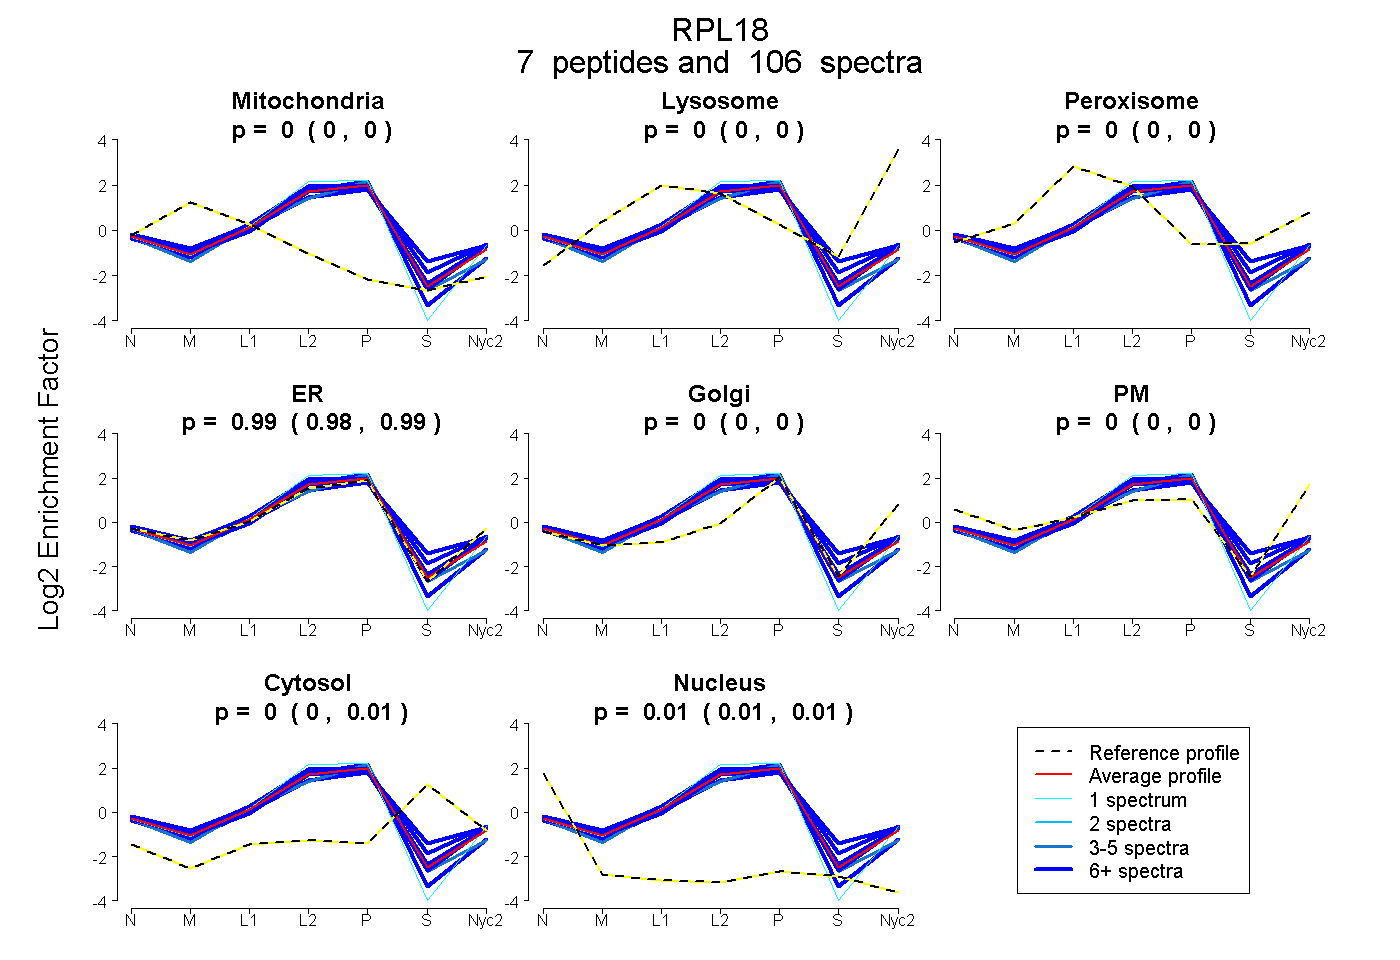
0.000 | 0.000
0.000 | 0.000
0.000 | 0.000
0.981 | 0.988
0.000 | 0.000
0.000 | 0.000
0.000 | 0.012
0.006 | 0.014
7peptides
spectra
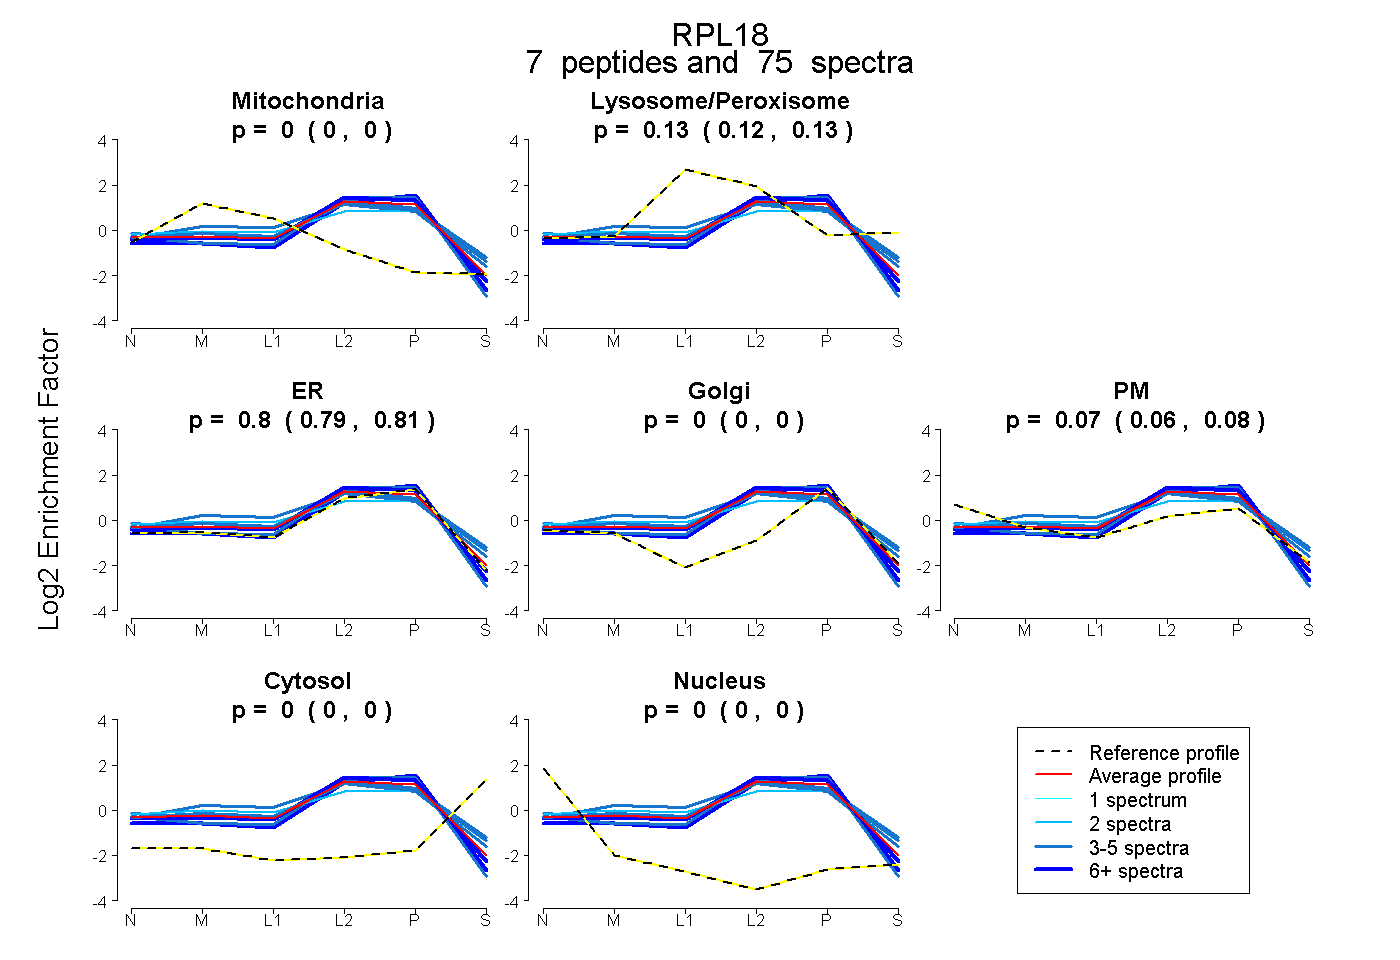
0.000 | 0.000
0.119 | 0.133
0.785 | 0.810
0.000 | 0.000
0.064 | 0.083
0.000 | 0.000
0.000 | 0.000
9peptides
spectra
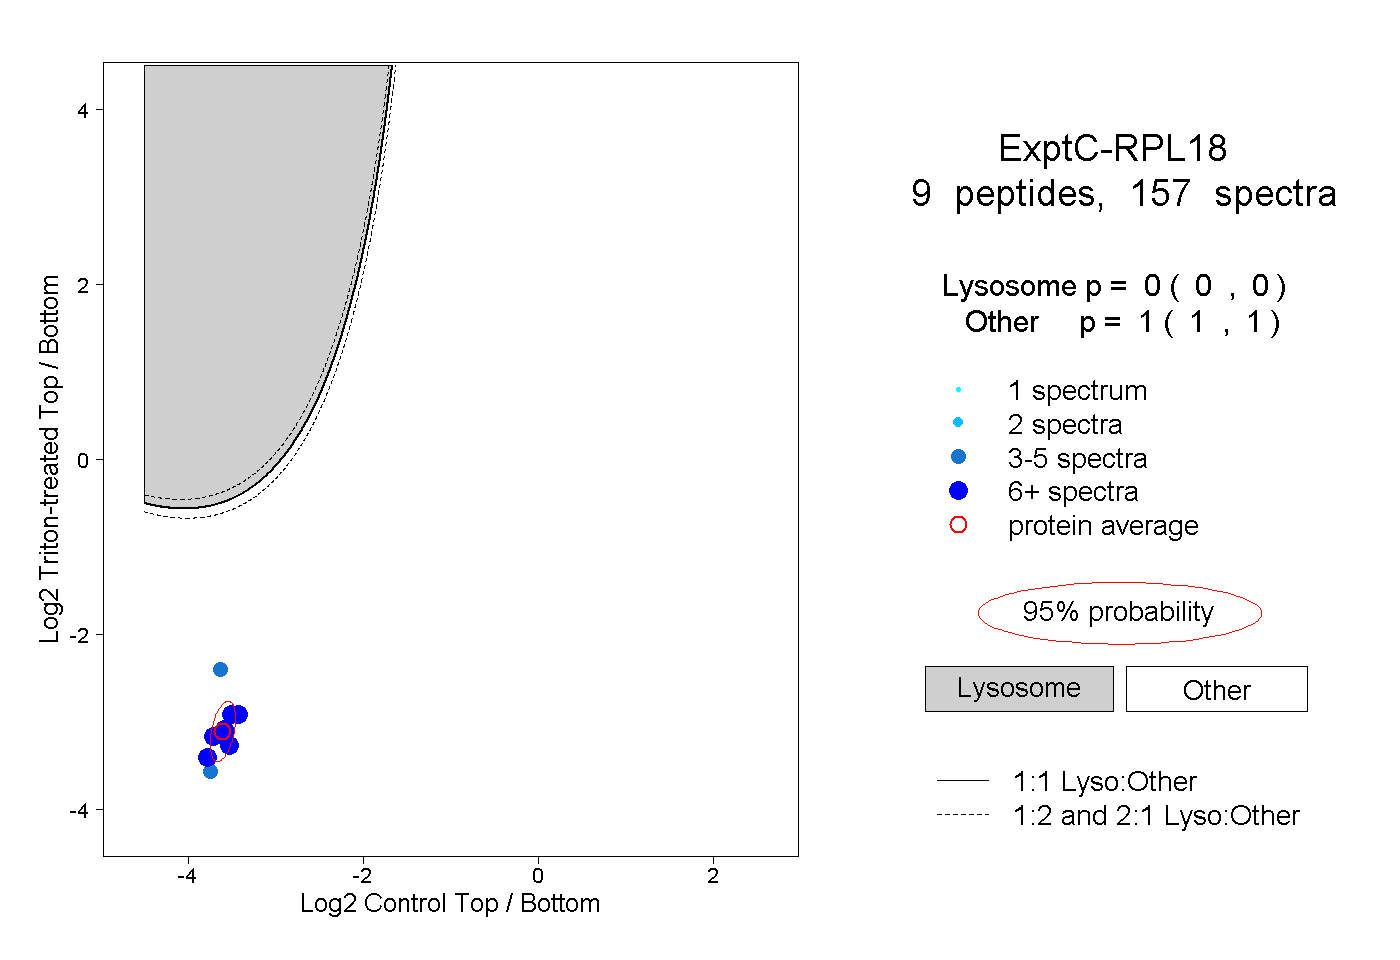
0.000 | 0.000
1.000 | 1.000
6peptides
spectra
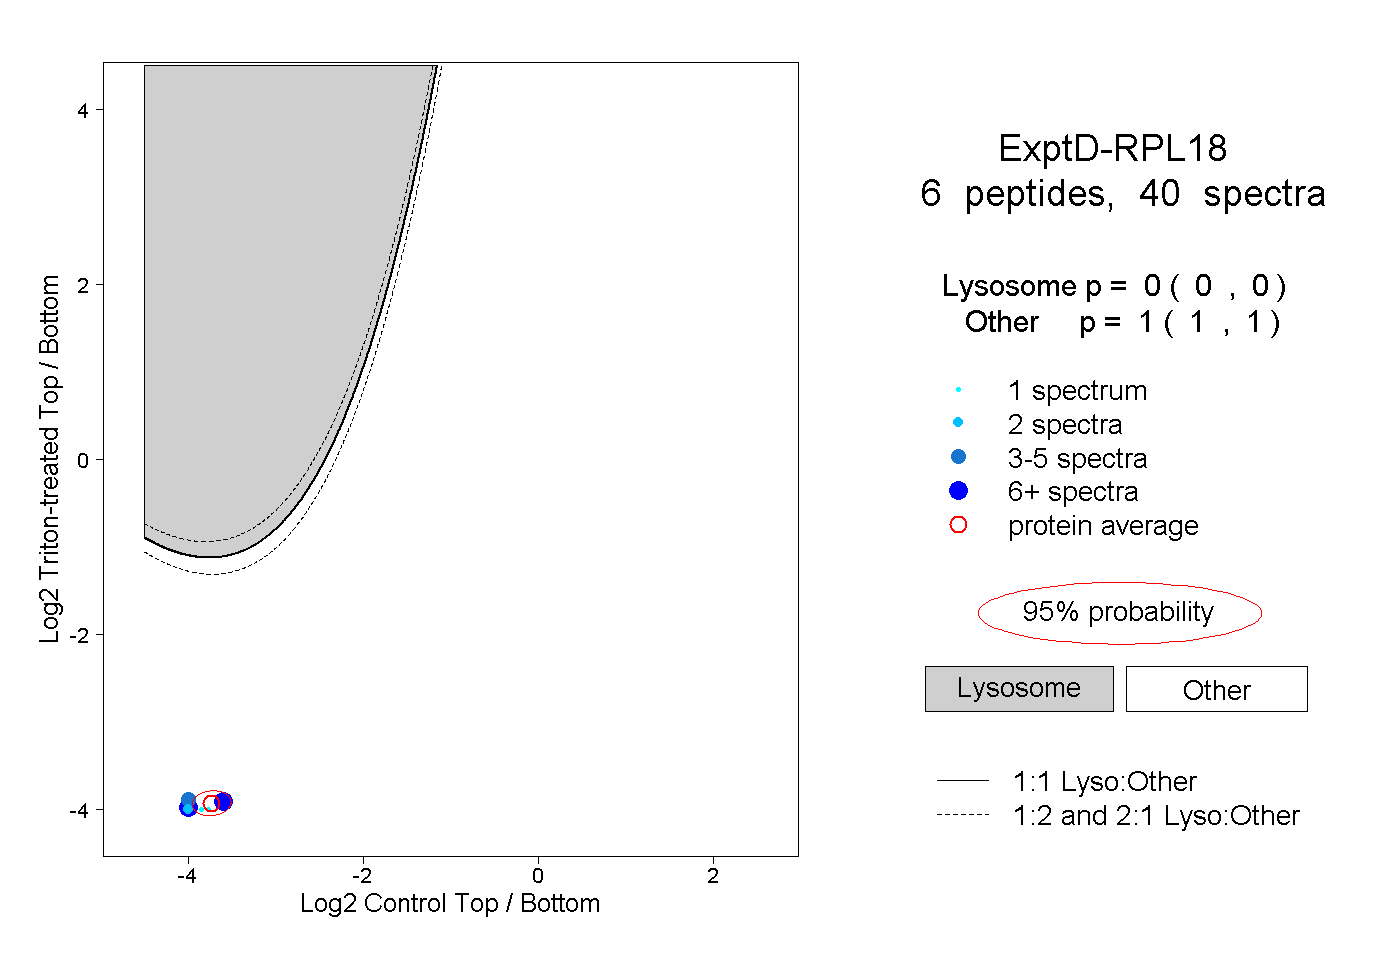
0.000 | 0.000
1.000 | 1.000