 7
7peptides
spectra
0.000 | 0.000
0.000 | 0.000
0.000 | 0.000
0.981 | 0.988
0.000 | 0.000
0.000 | 0.000
0.000 | 0.012
0.006 | 0.014
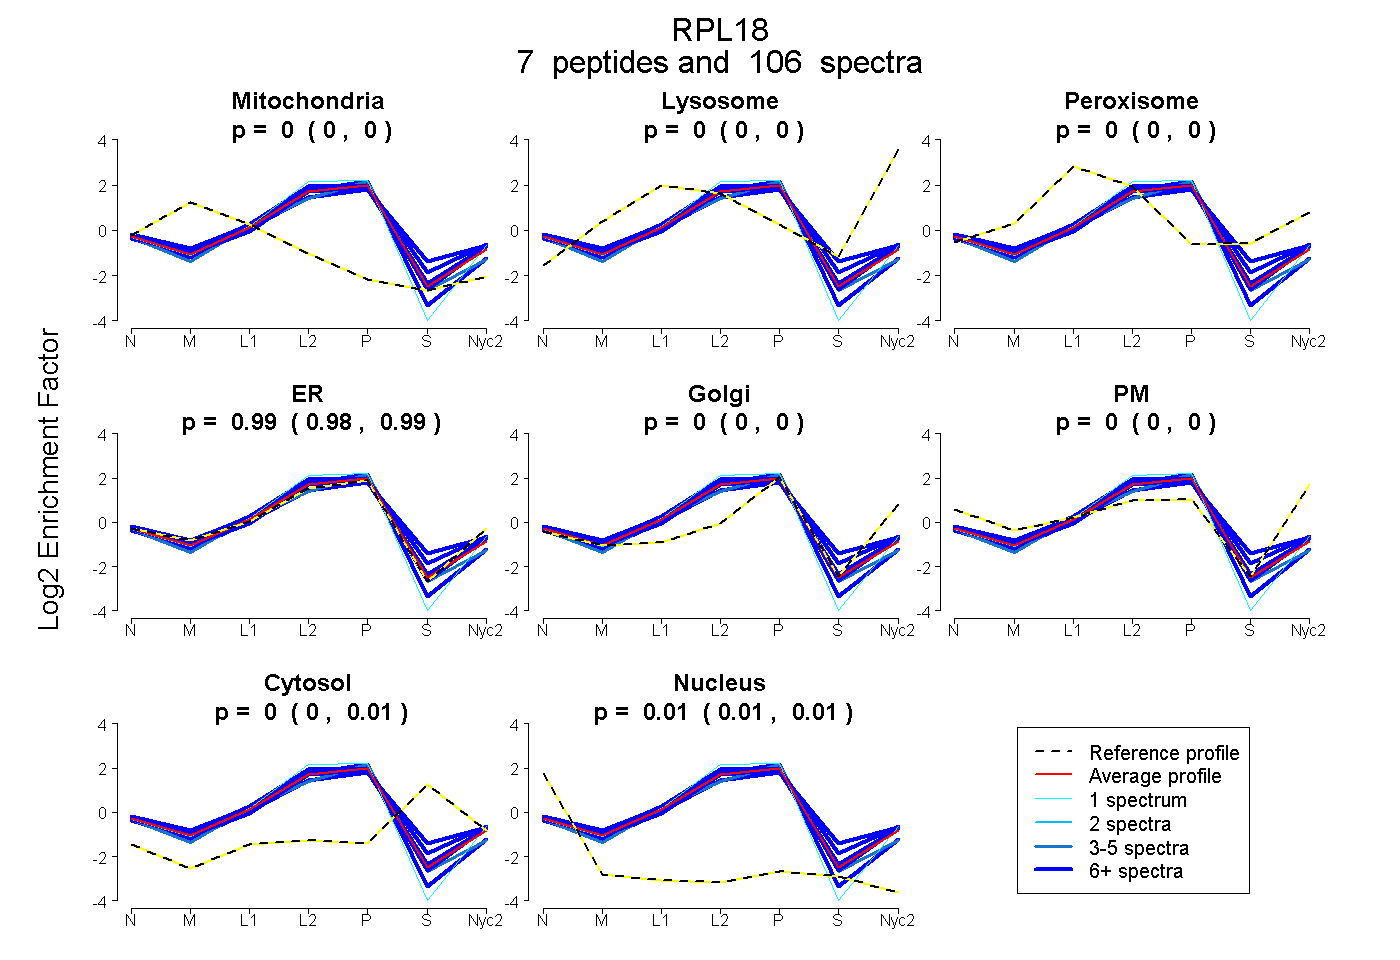
| Plot | Mito | Lyso | Perox | ER | Golgi | PM | Cytosol | Nucleus | |||||
| Expt A |
7 peptides |
106 spectra |
|
0.000 0.000 | 0.000 |
0.000 0.000 | 0.000 |
0.000 0.000 | 0.000 |
0.985 0.981 | 0.988 |
0.000 0.000 | 0.000 |
0.000 0.000 | 0.000 |
0.004 0.000 | 0.012 |
0.011 0.006 | 0.014 |
| 8 spectra, ILTFDQLALESPK | 0.000 | 0.000 | 0.028 | 0.822 | 0.000 | 0.000 | 0.150 | 0.000 | ||
| 1 spectrum, TNSTFNQVVLK | 0.000 | 0.000 | 0.000 | 1.000 | 0.000 | 0.000 | 0.000 | 0.000 | ||
| 4 spectra, SQDIYLR | 0.000 | 0.000 | 0.000 | 0.950 | 0.000 | 0.000 | 0.000 | 0.050 | ||
| 15 spectra, TAVVVGTITDDVR | 0.000 | 0.000 | 0.004 | 0.917 | 0.000 | 0.000 | 0.079 | 0.000 | ||
| 25 spectra, GTVLLSGPR | 0.000 | 0.000 | 0.000 | 0.980 | 0.000 | 0.000 | 0.000 | 0.020 | ||
| 14 spectra, ILEVPK | 0.000 | 0.000 | 0.043 | 0.945 | 0.000 | 0.000 | 0.000 | 0.012 | ||
| 39 spectra, TNRPPLSLSR | 0.000 | 0.000 | 0.000 | 1.000 | 0.000 | 0.000 | 0.000 | 0.000 |
| Plot | Mito | Lyso or Perox | ER | Golgi | PM | Cytosol | Nucleus | ||||||
| Expt B |
7 peptides |
75 spectra |
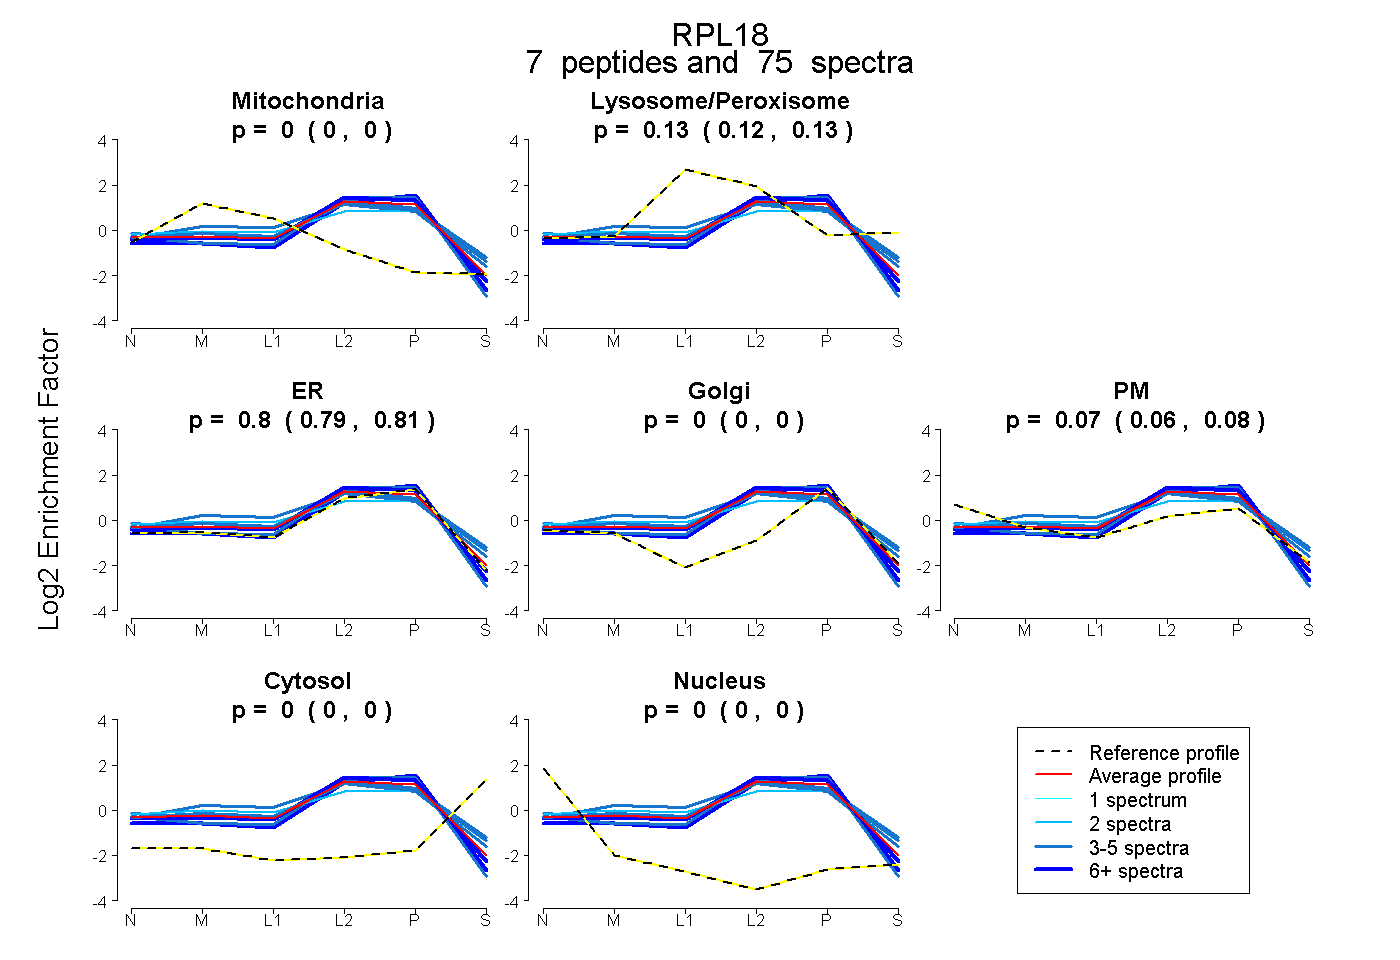 |
0.000 0.000 | 0.000 |
0.126 0.119 | 0.133 |
0.799 0.785 | 0.810 |
0.000 0.000 | 0.000 |
0.074 0.064 | 0.083 |
0.000 0.000 | 0.000 |
0.000 0.000 | 0.000 |
|||
| Plot | Lyso | Other | |||||||||||
| Expt C |
9 peptides |
157 spectra |
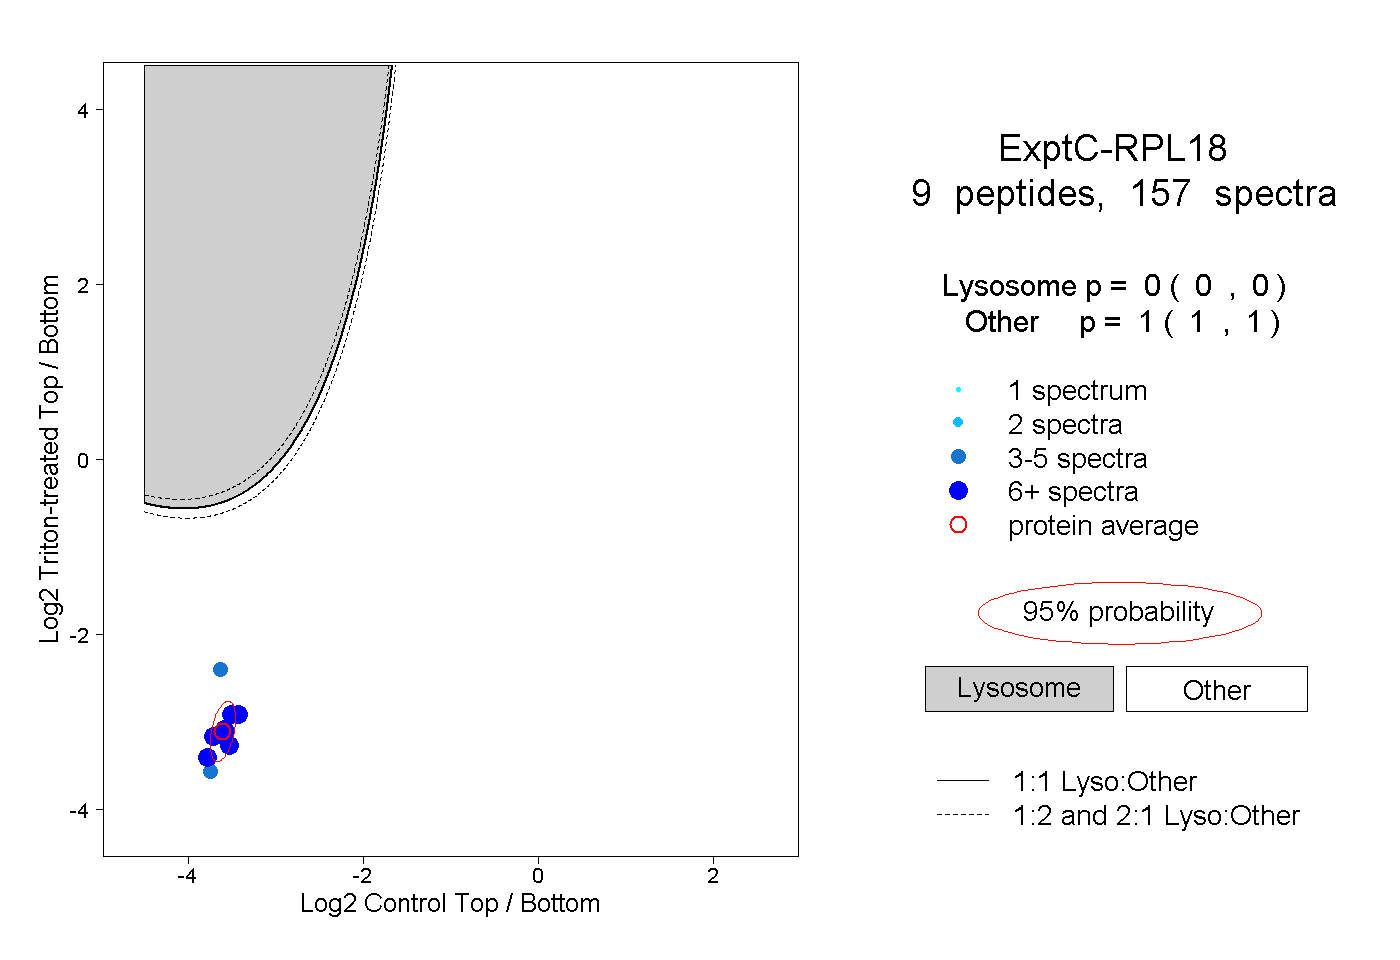 |
0.000 0.000 | 0.000 |
1.000 1.000 | 1.000 |
||||||||
| Plot | Lyso | Other | |||||||||||
| Expt D |
6 peptides |
40 spectra |
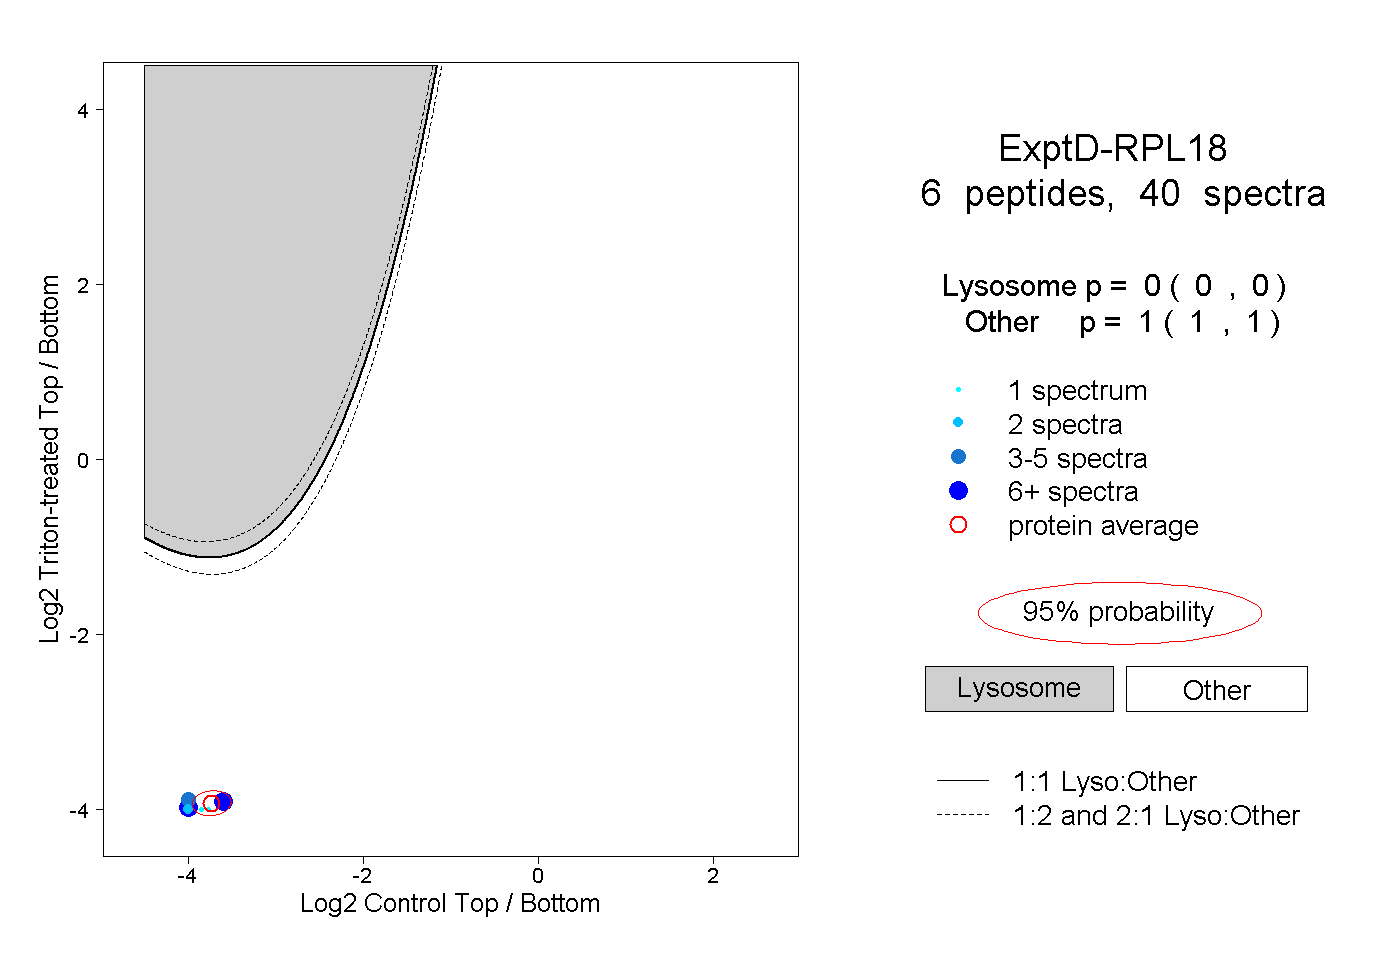 |
0.000 0.000 | 0.000 |
1.000 1.000 | 1.000 |