 2
2peptides
spectra
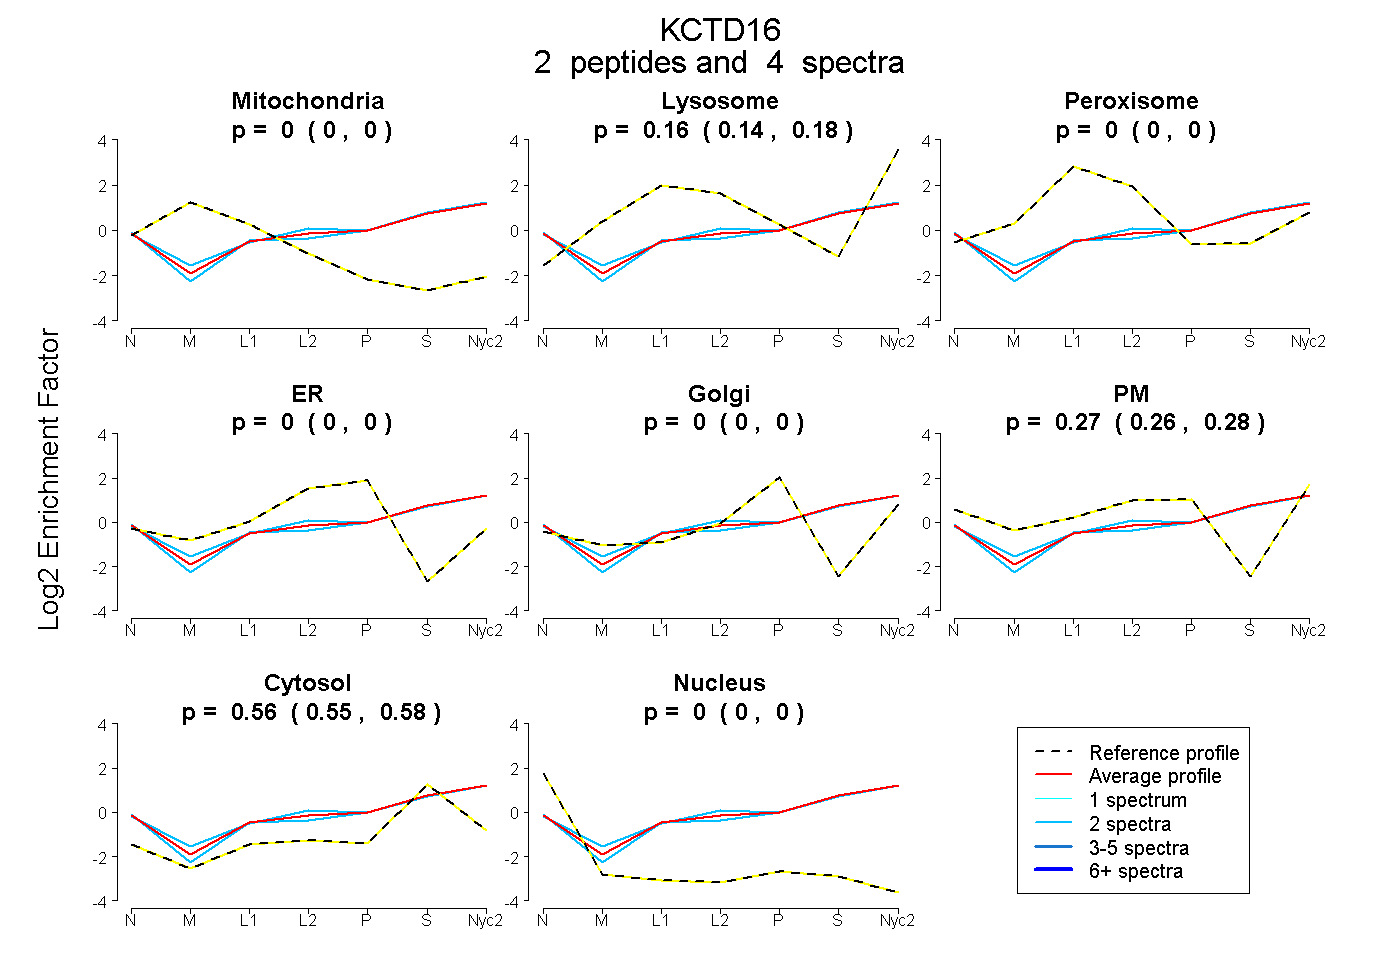
0.000 | 0.000
0.145 | 0.178
0.000 | 0.000
0.000 | 0.000
0.000 | 0.000
0.258 | 0.285
0.550 | 0.577
0.000 | 0.000
1peptide
spectra
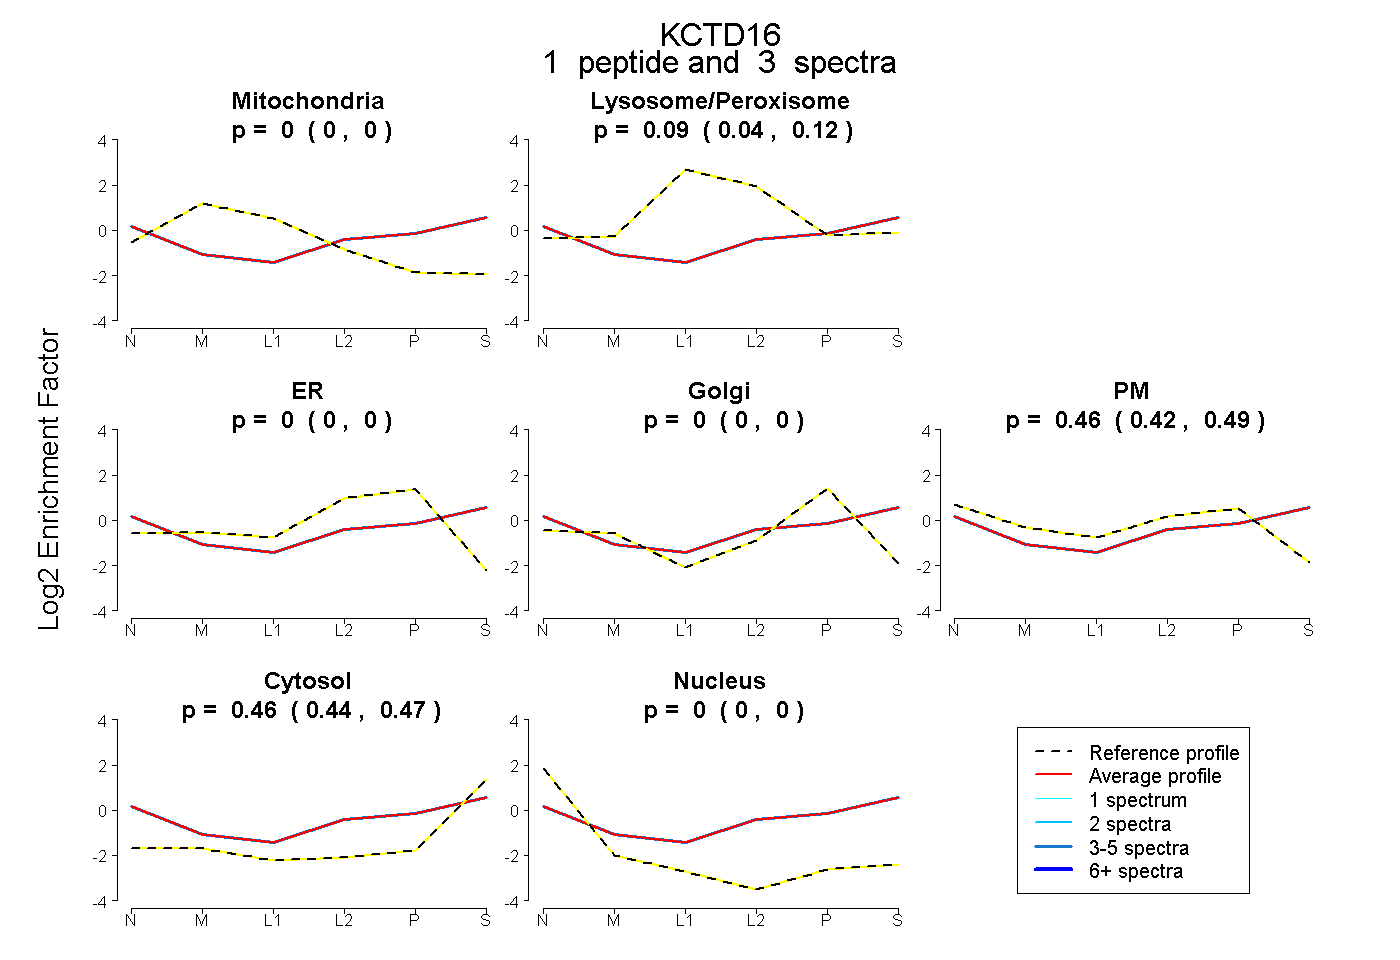
0.000 | 0.000
0.041 | 0.123
0.000 | 0.000
0.000 | 0.000
0.421 | 0.489
0.436 | 0.472
0.000 | 0.000
2peptides
spectra
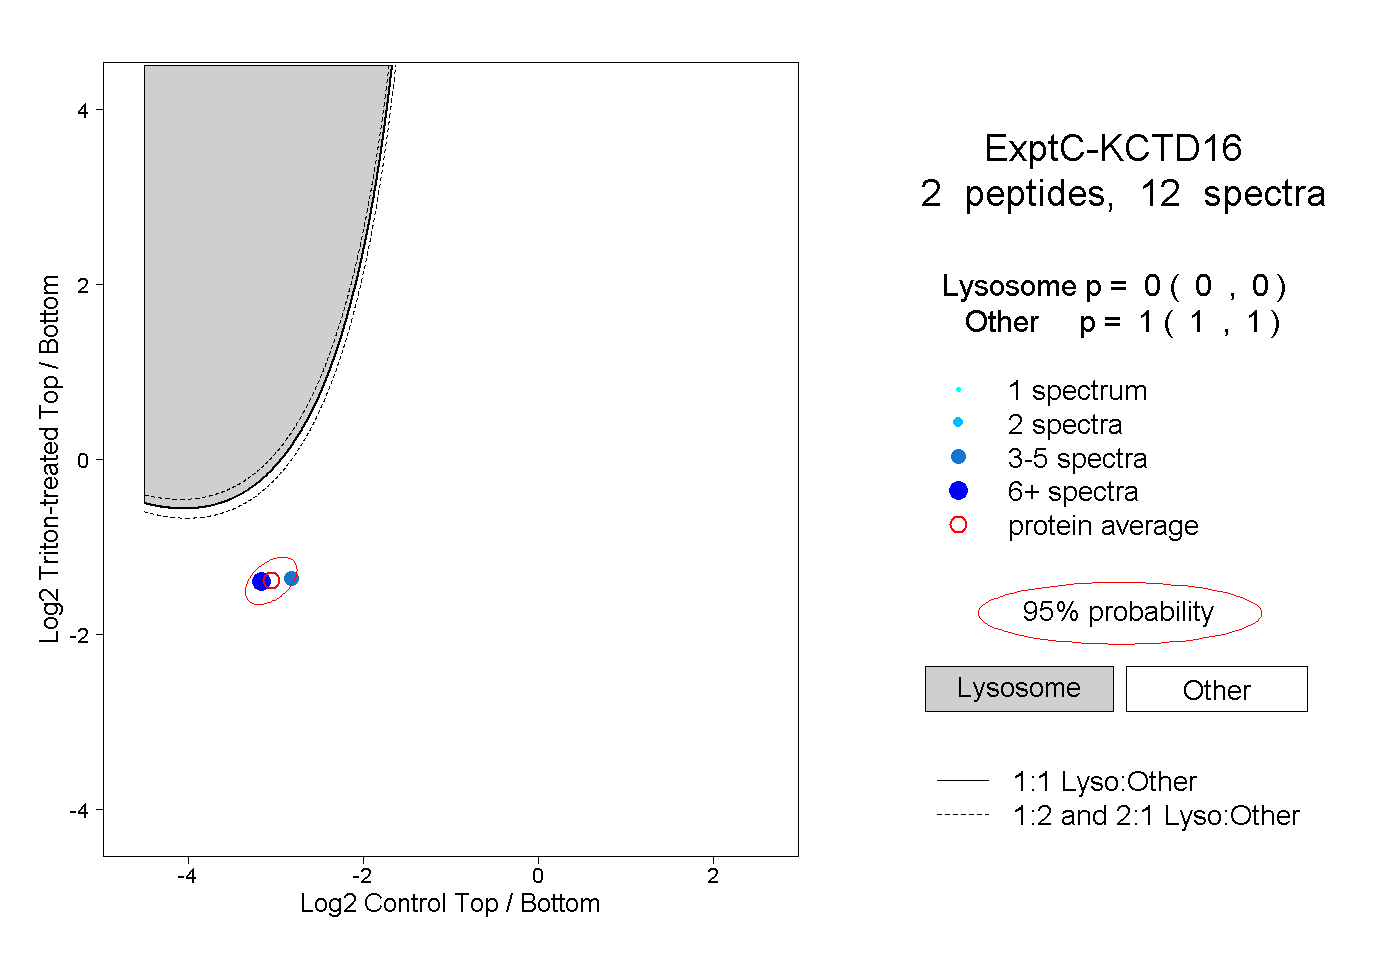
0.000 | 0.000
1.000 | 1.000