 2
2peptides
spectra
0.000 | 0.000
0.145 | 0.178
0.000 | 0.000
0.000 | 0.000
0.000 | 0.000
0.258 | 0.285
0.550 | 0.577
0.000 | 0.000
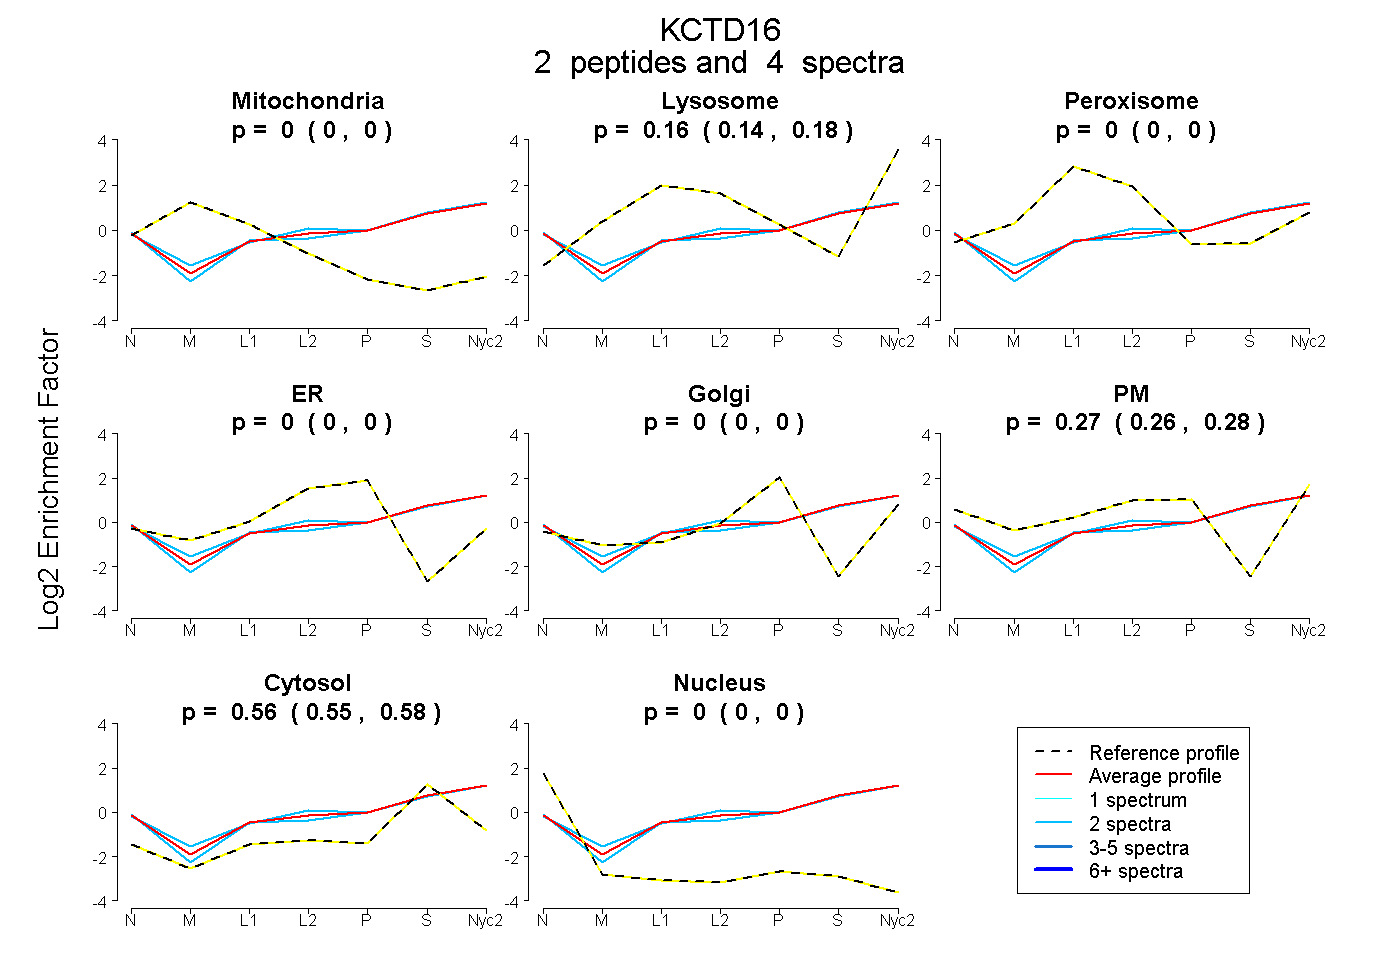
| Plot | Mito | Lyso | Perox | ER | Golgi | PM | Cytosol | Nucleus | |||||
| Expt A |
2 peptides |
4 spectra |
|
0.000 0.000 | 0.000 |
0.163 0.145 | 0.178 |
0.000 0.000 | 0.000 |
0.000 0.000 | 0.000 |
0.000 0.000 | 0.000 |
0.272 0.258 | 0.285 |
0.564 0.550 | 0.577 |
0.000 0.000 | 0.000 |
| 2 spectra, YILDYLR | 0.000 | 0.133 | 0.000 | 0.000 | 0.000 | 0.275 | 0.592 | 0.000 | ||
| 2 spectra, EGQADAK | 0.000 | 0.193 | 0.000 | 0.000 | 0.000 | 0.269 | 0.537 | 0.000 |
| Plot | Mito | Lyso or Perox | ER | Golgi | PM | Cytosol | Nucleus | ||||||
| Expt B |
1 peptide |
3 spectra |
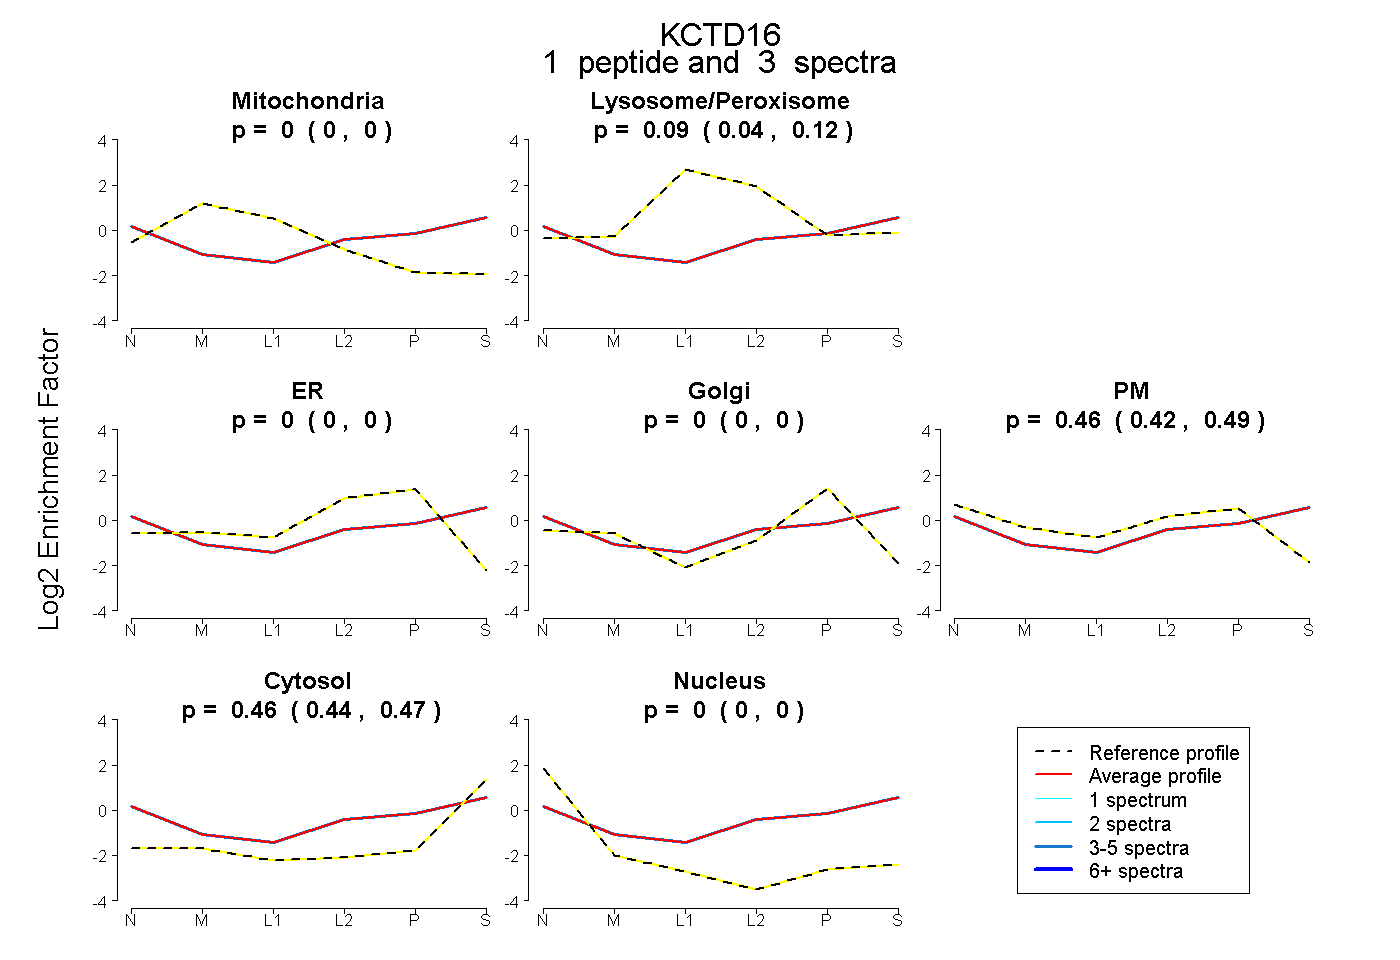 |
0.000 0.000 | 0.000 |
0.085 0.041 | 0.123 |
0.000 0.000 | 0.000 |
0.000 0.000 | 0.000 |
0.459 0.421 | 0.489 |
0.456 0.436 | 0.472 |
0.000 0.000 | 0.000 |
|||
| Plot | Lyso | Other | |||||||||||
| Expt C |
2 peptides |
12 spectra |
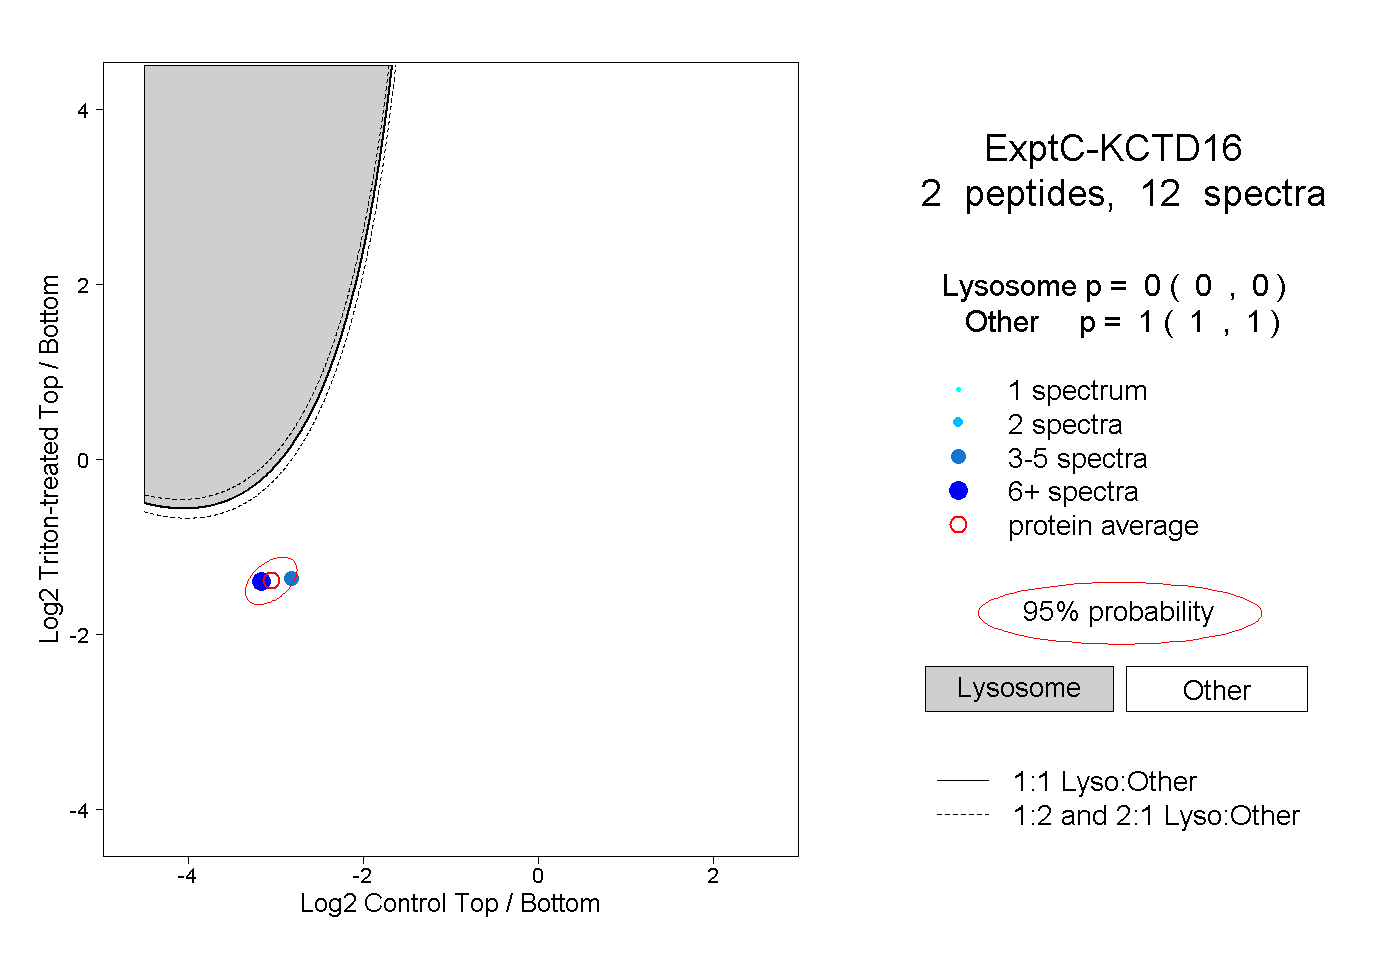 |
0.000 0.000 | 0.000 |
1.000 1.000 | 1.000 |