 7
7peptides
spectra
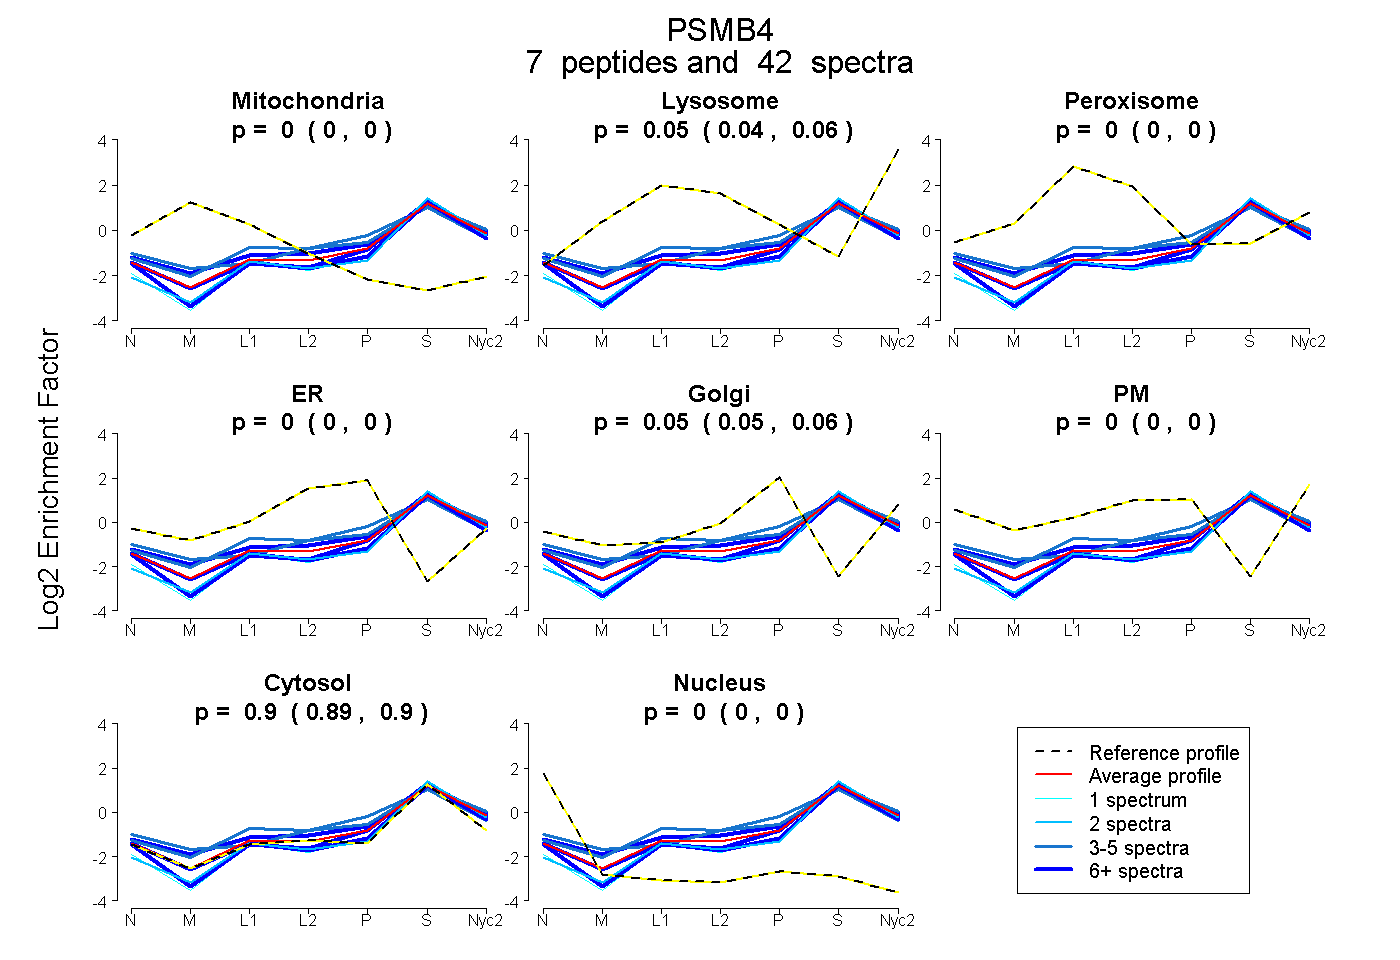
0.000 | 0.000
0.041 | 0.056
0.000 | 0.000
0.000 | 0.000
0.047 | 0.062
0.000 | 0.000
0.890 | 0.901
0.000 | 0.000
4peptides
spectra
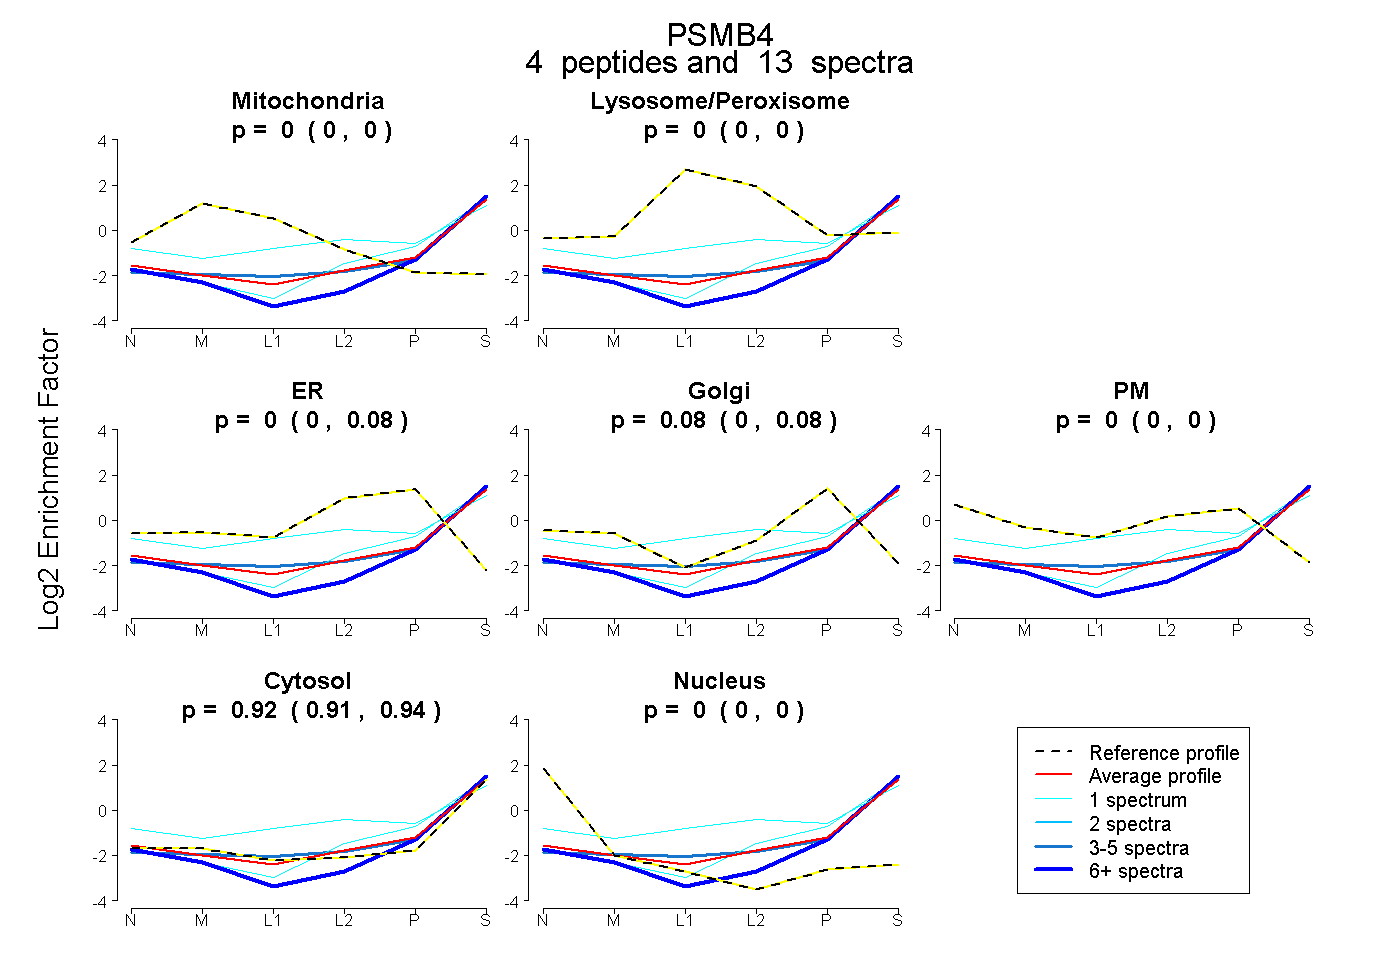
0.000 | 0.000
0.000 | 0.005
0.000 | 0.078
0.000 | 0.085
0.000 | 0.000
0.909 | 0.938
0.000 | 0.000
4peptides
spectra
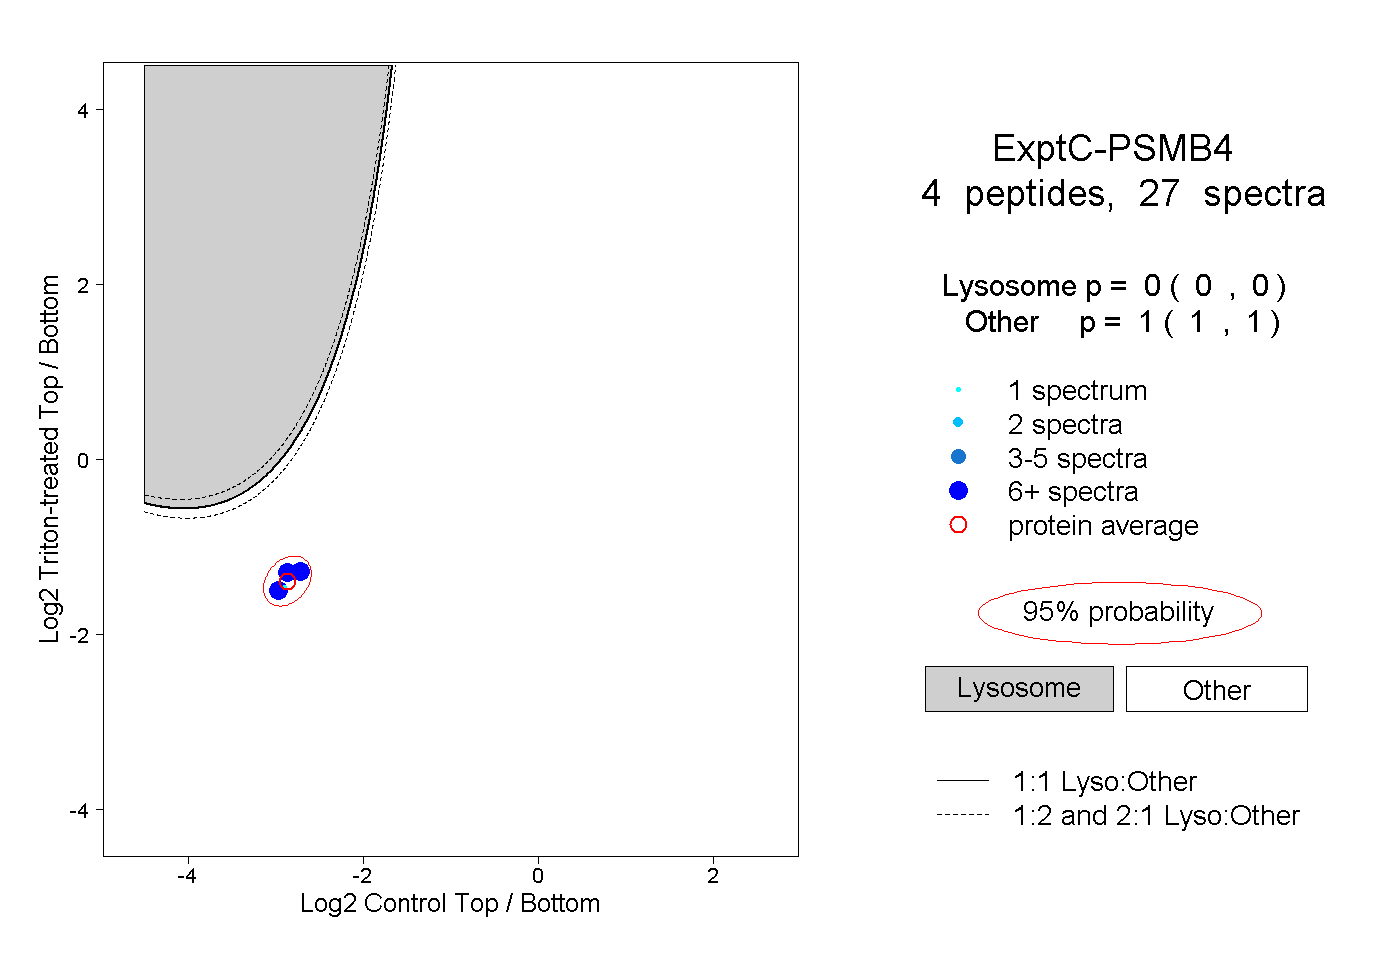
0.000 | 0.000
1.000 | 1.000
3peptides
spectra
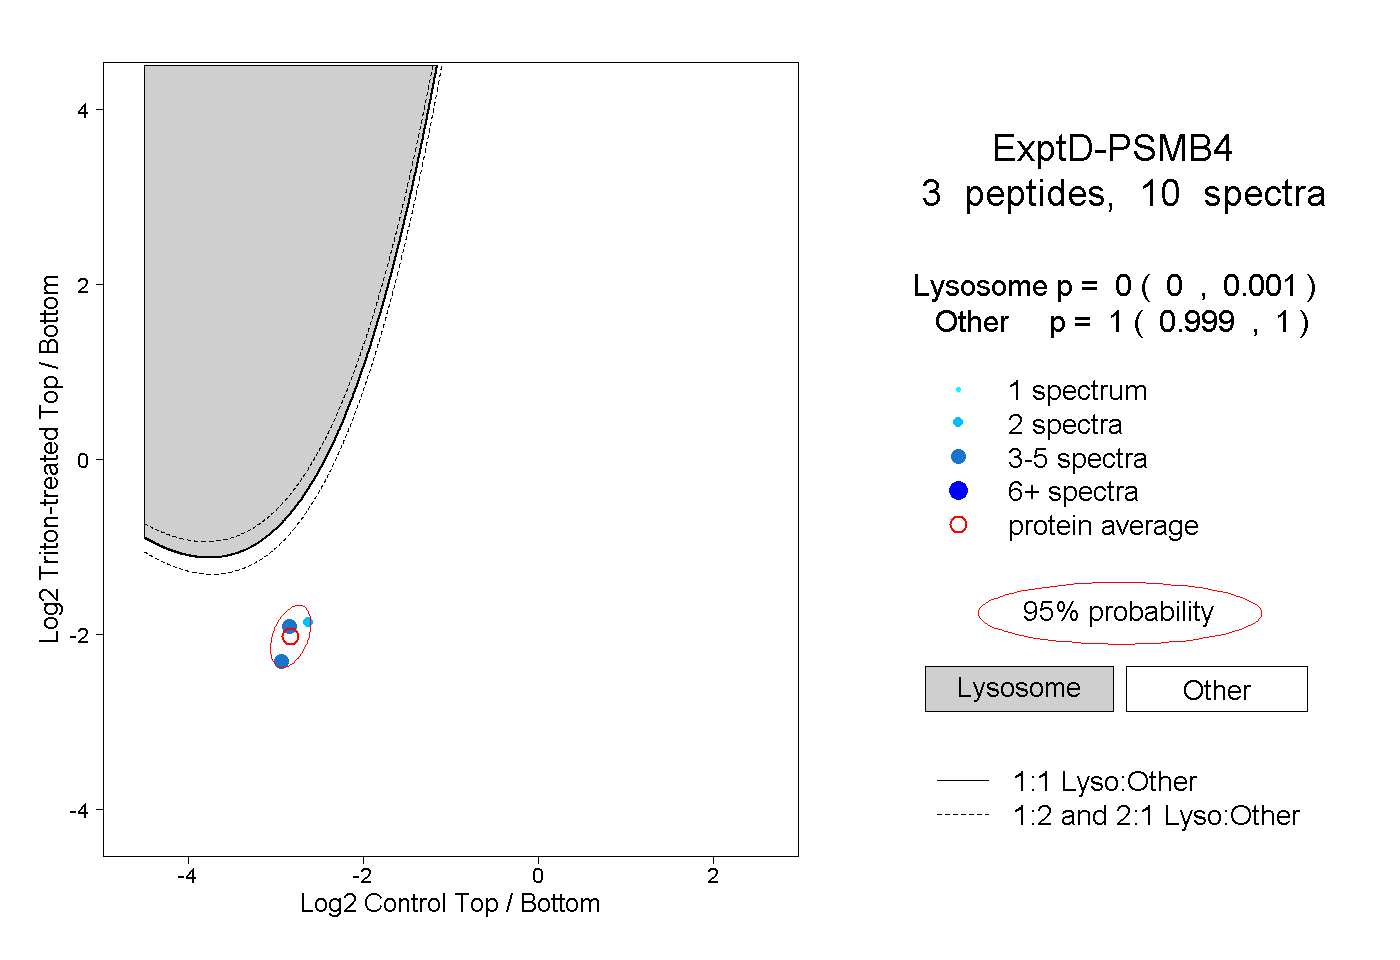
0.000 | 0.001
0.999 | 1.000