 7
7peptides
spectra
0.000 | 0.000
0.041 | 0.056
0.000 | 0.000
0.000 | 0.000
0.047 | 0.062
0.000 | 0.000
0.890 | 0.901
0.000 | 0.000
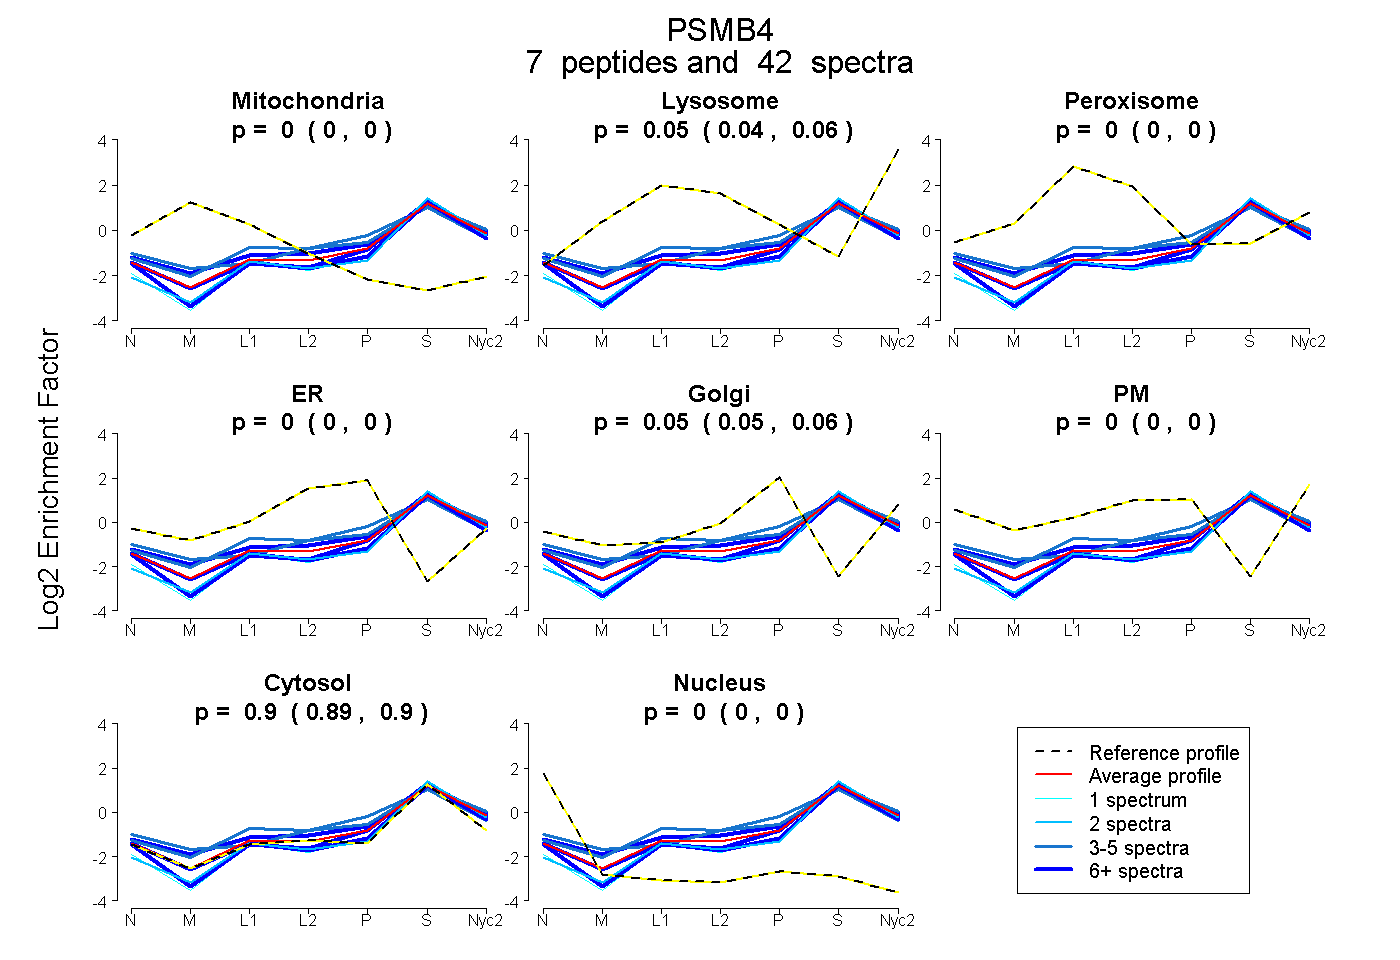
| Plot | Mito | Lyso | Perox | ER | Golgi | PM | Cytosol | Nucleus | |||||
| Expt A |
7 peptides |
42 spectra |
|
0.000 0.000 | 0.000 |
0.049 0.041 | 0.056 |
0.000 0.000 | 0.000 |
0.000 0.000 | 0.000 |
0.055 0.047 | 0.062 |
0.000 0.000 | 0.000 |
0.896 0.890 | 0.901 |
0.000 0.000 | 0.000 |
| 3 spectra, AMYSR | 0.000 | 0.028 | 0.000 | 0.000 | 0.213 | 0.000 | 0.758 | 0.000 | ||
| 1 spectrum, FQVATVTEK | 0.000 | 0.000 | 0.000 | 0.000 | 0.000 | 0.000 | 1.000 | 0.000 | ||
| 17 spectra, AIHSWLTR | 0.000 | 0.109 | 0.000 | 0.000 | 0.078 | 0.000 | 0.813 | 0.000 | ||
| 10 spectra, QPVLSQTEAR | 0.000 | 0.000 | 0.000 | 0.000 | 0.033 | 0.000 | 0.967 | 0.000 | ||
| 6 spectra, TQNPMVTGTSVLGVK | 0.000 | 0.010 | 0.000 | 0.000 | 0.024 | 0.000 | 0.966 | 0.000 | ||
| 2 spectra, VNDSTMLGASGDYADFQYLK | 0.000 | 0.000 | 0.000 | 0.000 | 0.000 | 0.000 | 1.000 | 0.000 | ||
| 3 spectra, QVLGQMVIDEELLGDGHSYSPR | 0.000 | 0.164 | 0.000 | 0.000 | 0.048 | 0.000 | 0.789 | 0.000 |
| Plot | Mito | Lyso or Perox | ER | Golgi | PM | Cytosol | Nucleus | ||||||
| Expt B |
4 peptides |
13 spectra |
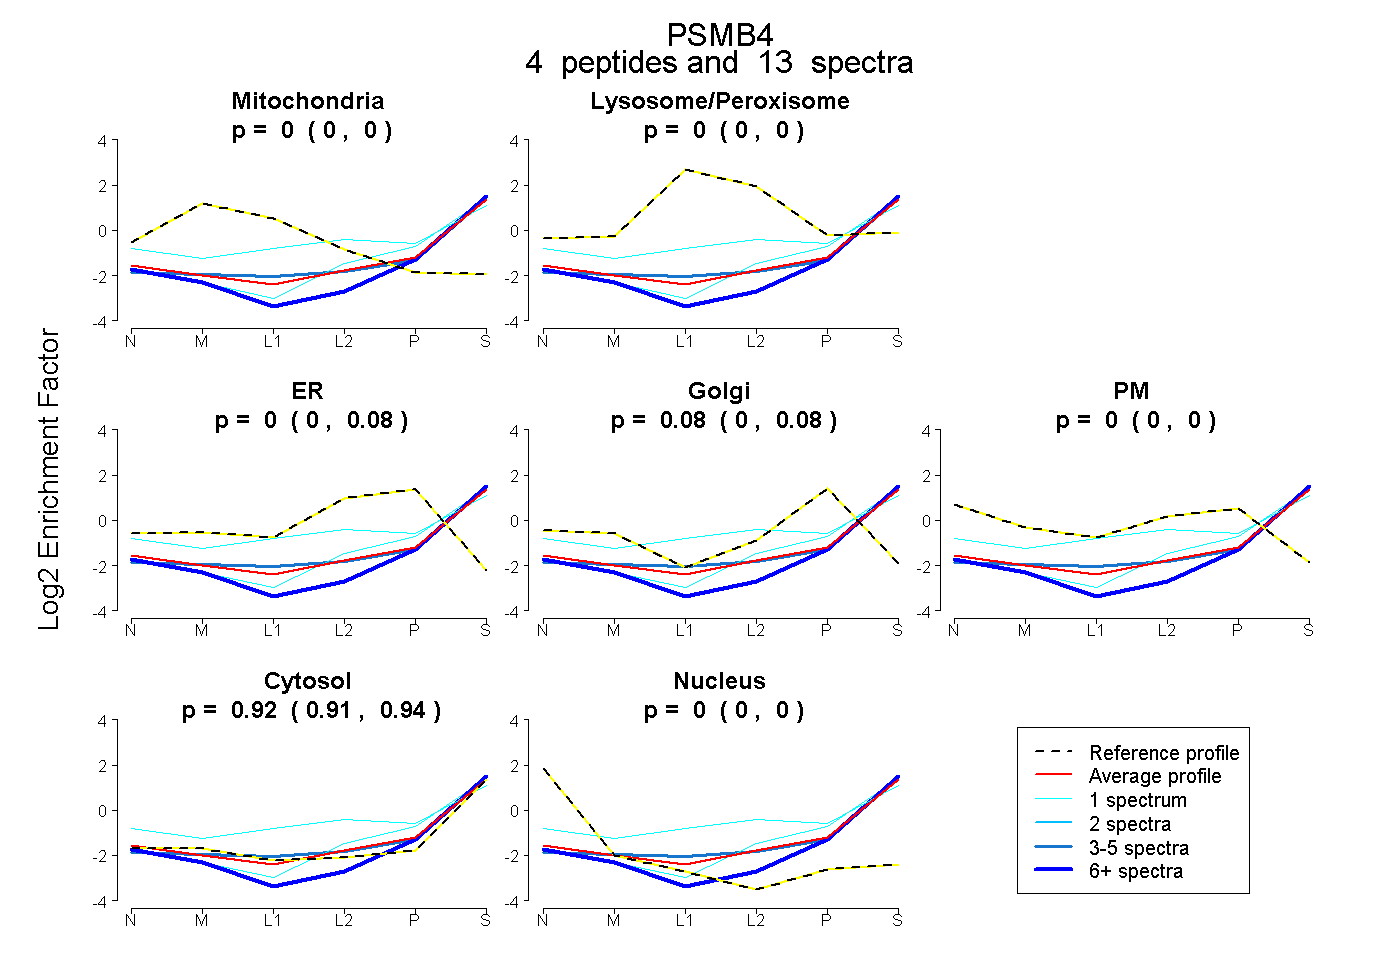 |
0.000 0.000 | 0.000 |
0.000 0.000 | 0.005 |
0.000 0.000 | 0.078 |
0.078 0.000 | 0.085 |
0.000 0.000 | 0.000 |
0.922 0.909 | 0.938 |
0.000 0.000 | 0.000 |
|||
| Plot | Lyso | Other | |||||||||||
| Expt C |
4 peptides |
27 spectra |
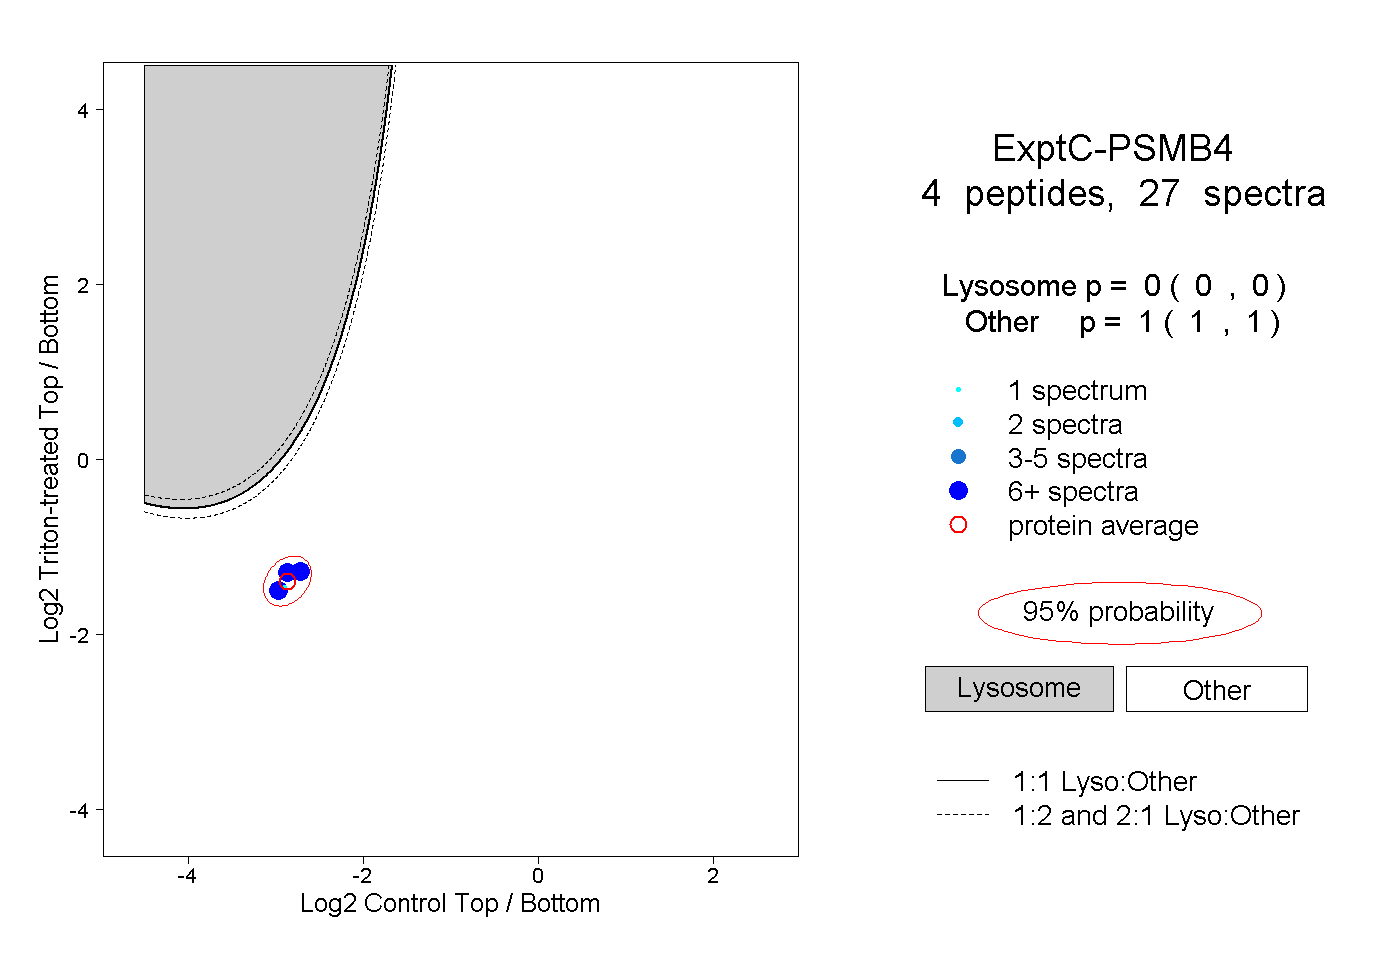 |
0.000 0.000 | 0.000 |
1.000 1.000 | 1.000 |
||||||||
| Plot | Lyso | Other | |||||||||||
| Expt D |
3 peptides |
10 spectra |
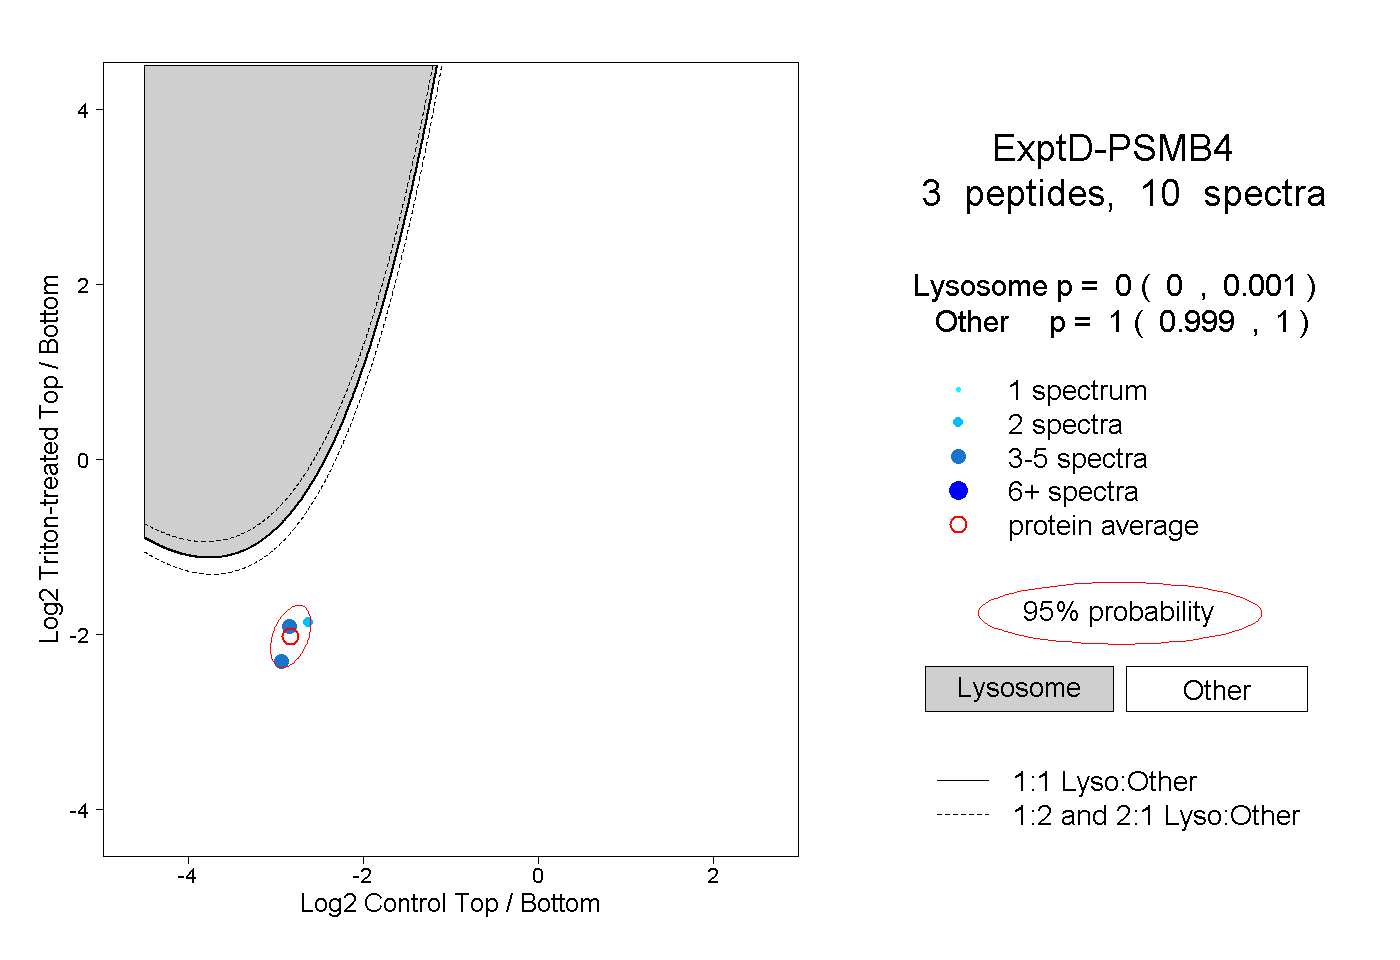 |
0.000 0.000 | 0.001 |
1.000 0.999 | 1.000 |