 3
3peptides
spectra
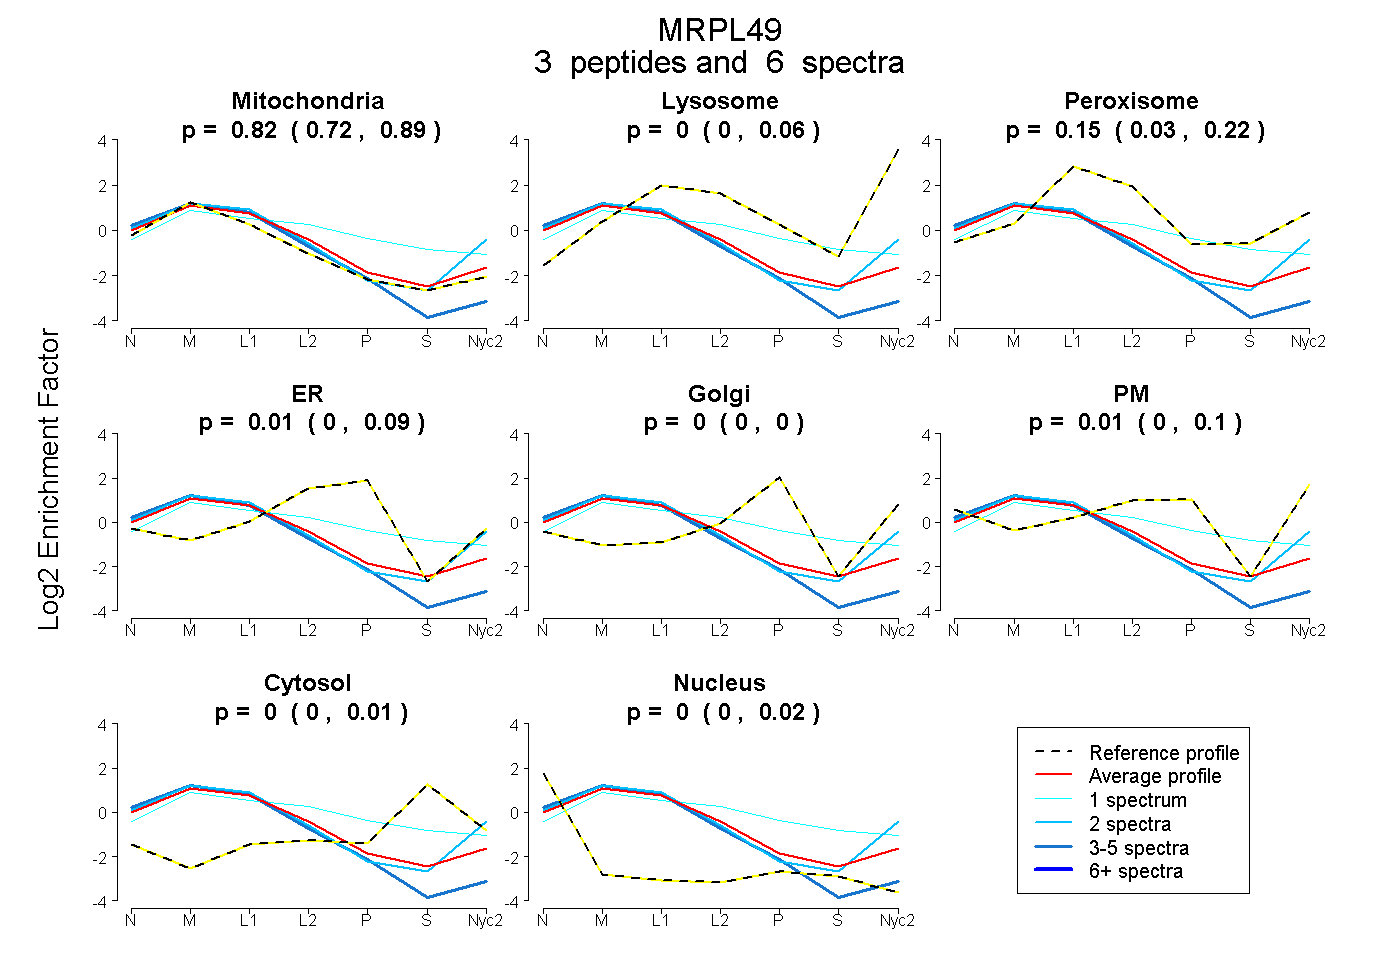
0.722 | 0.891
0.000 | 0.060
0.029 | 0.215
0.000 | 0.087
0.000 | 0.000
0.000 | 0.102
0.000 | 0.009
0.000 | 0.022
2peptides
spectra
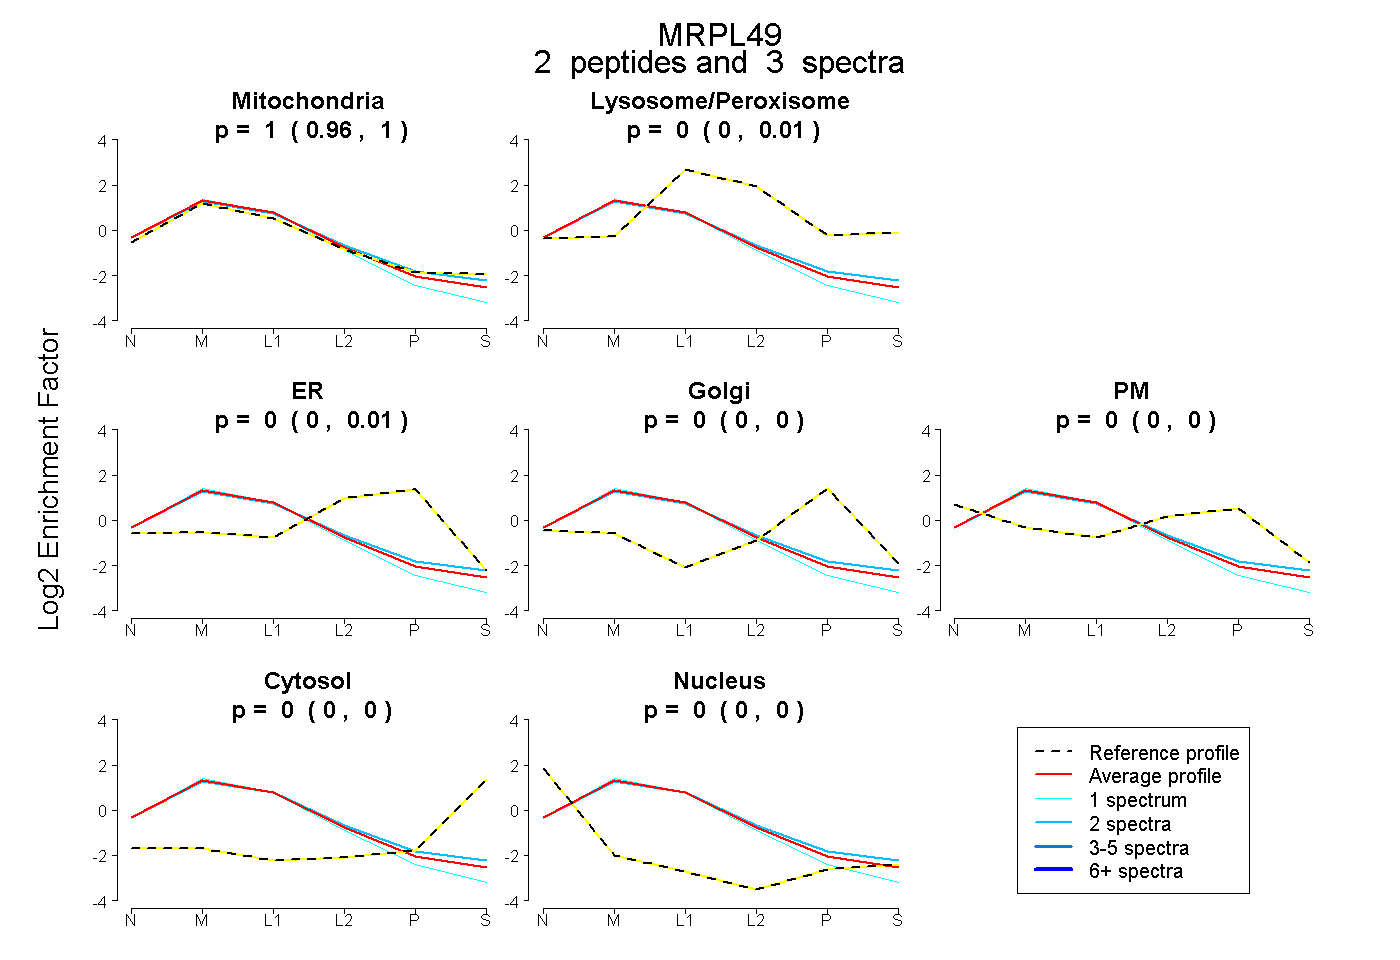
0.964 | 1.000
0.000 | 0.011
0.000 | 0.013
0.000 | 0.000
0.000 | 0.000
0.000 | 0.000
0.000 | 0.000
10peptides
spectra
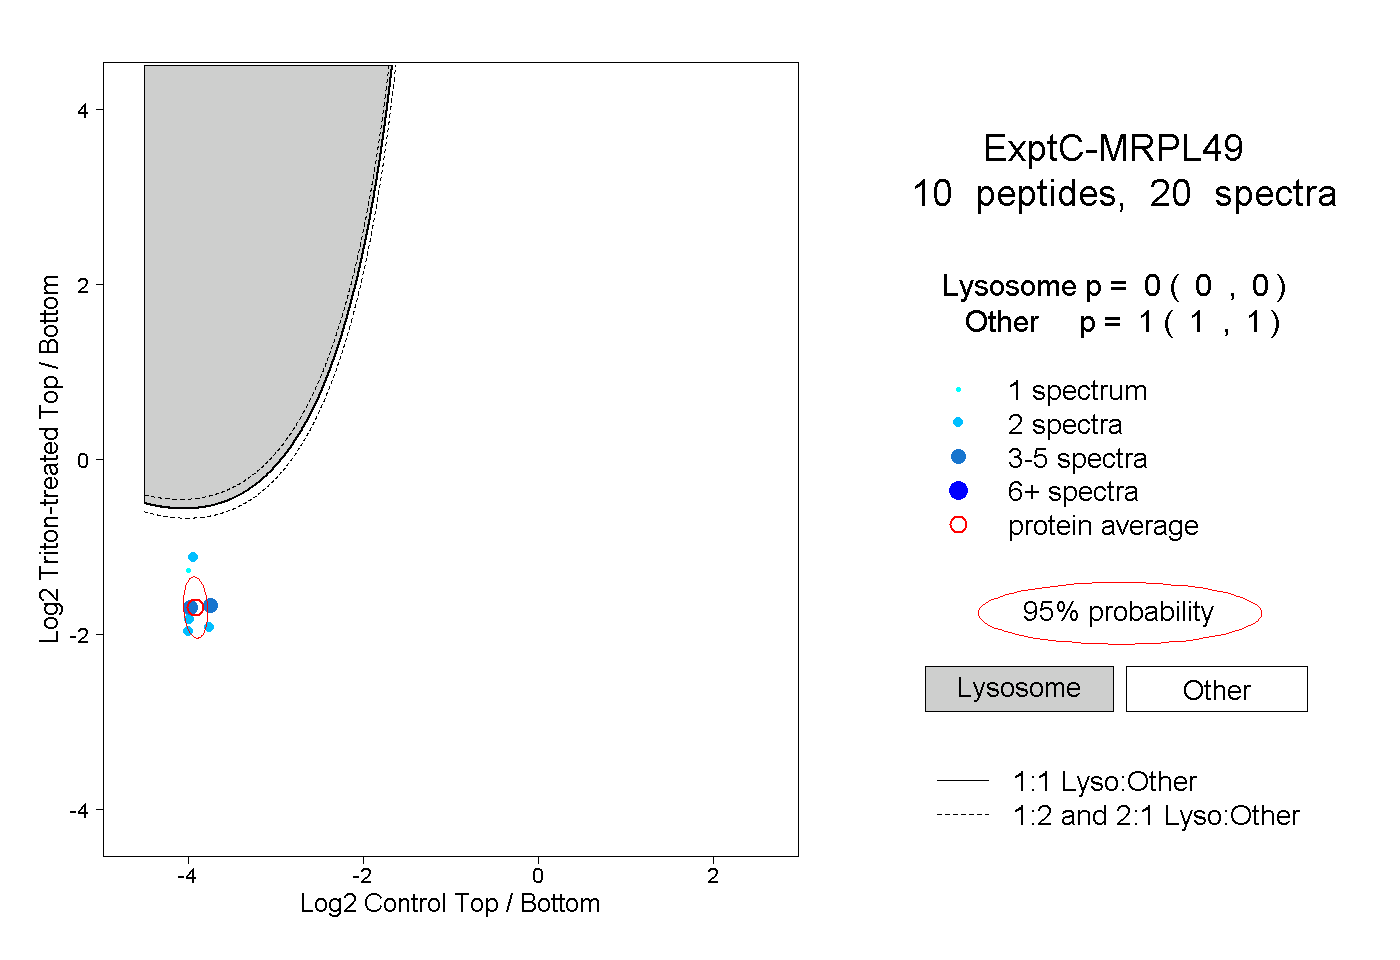
0.000 | 0.000
1.000 | 1.000
1peptide
spectrum
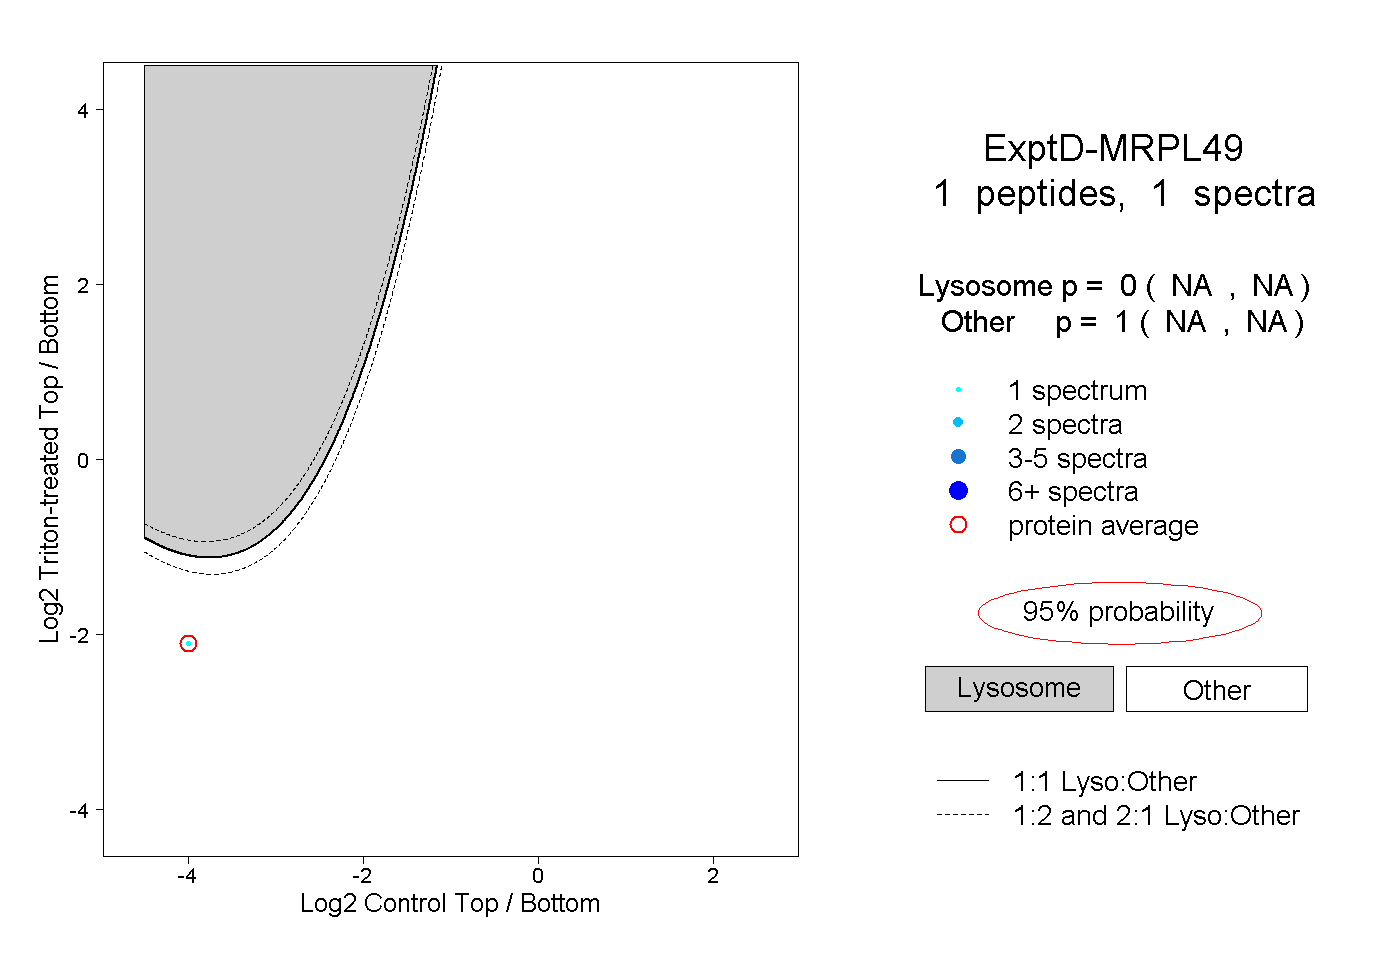
NA | NA
NA | NA