 3
3peptides
spectra
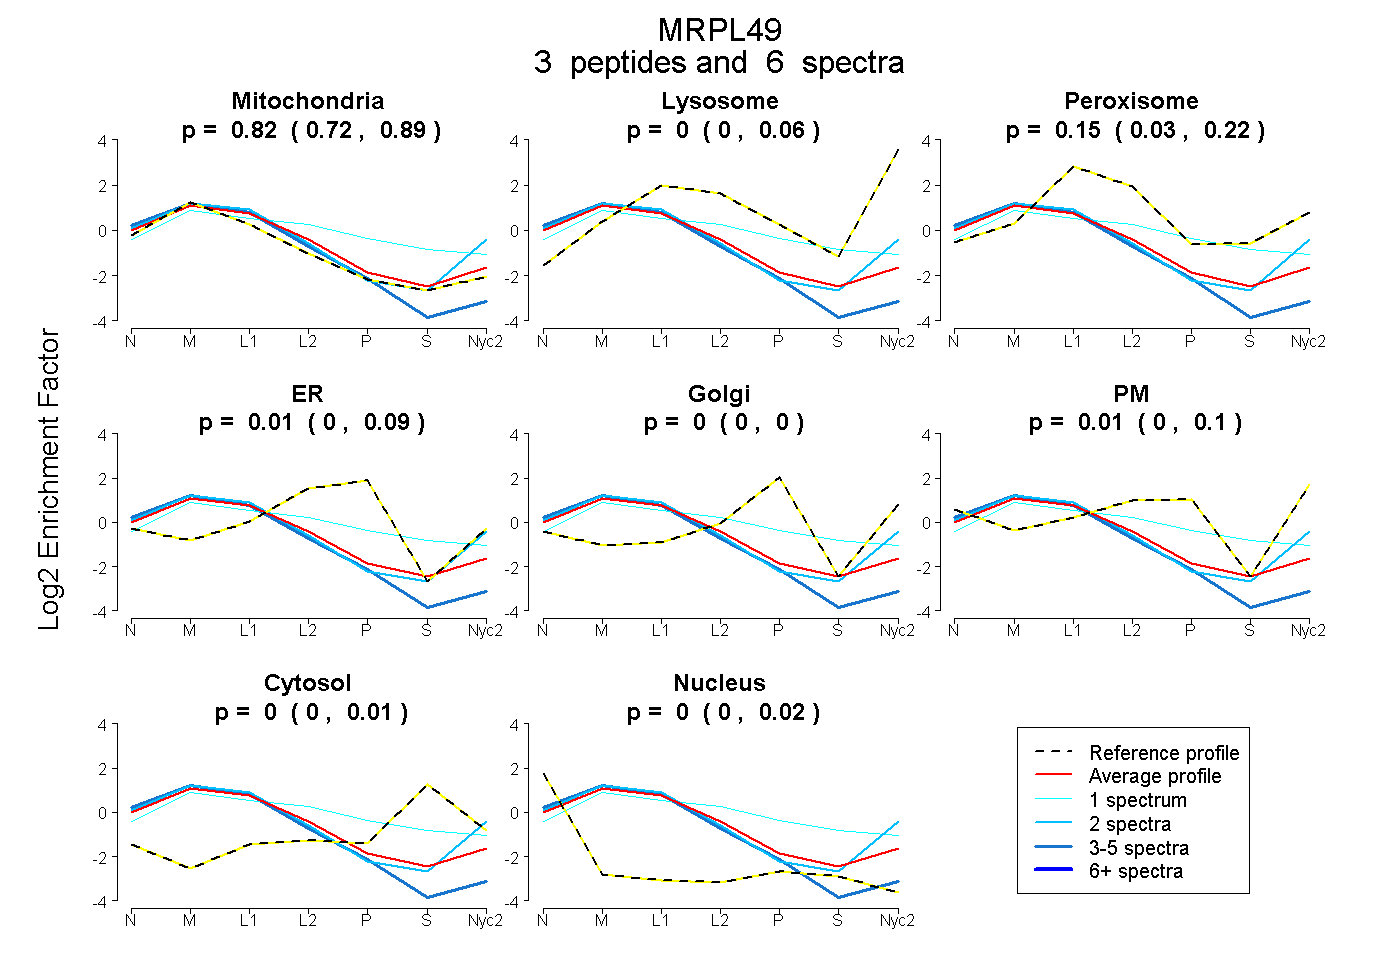
0.722 | 0.891
0.000 | 0.060
0.029 | 0.215
0.000 | 0.087
0.000 | 0.000
0.000 | 0.102
0.000 | 0.009
0.000 | 0.022
| Plot | Mito | Lyso | Perox | ER | Golgi | PM | Cytosol | Nucleus | |||||
| Expt A |
3 peptides |
6 spectra |
|
0.823 0.722 | 0.891 |
0.000 0.000 | 0.060 |
0.153 0.029 | 0.215 |
0.013 0.000 | 0.087 |
0.000 0.000 | 0.000 |
0.011 0.000 | 0.102 |
0.000 0.000 | 0.009 |
0.000 0.000 | 0.022 |
| 1 spectrum, MHNIPVYK | 0.398 | 0.000 | 0.292 | 0.175 | 0.000 | 0.000 | 0.135 | 0.000 | ||
| 2 spectra, TPVTQVNEVTGTLR | 0.790 | 0.210 | 0.000 | 0.000 | 0.000 | 0.000 | 0.000 | 0.000 | ||
| 3 spectra, DVEEFLSPLLGK | 0.979 | 0.000 | 0.000 | 0.000 | 0.000 | 0.000 | 0.000 | 0.021 |
| Plot | Mito | Lyso or Perox | ER | Golgi | PM | Cytosol | Nucleus | ||||||
| Expt B |
2 peptides |
3 spectra |
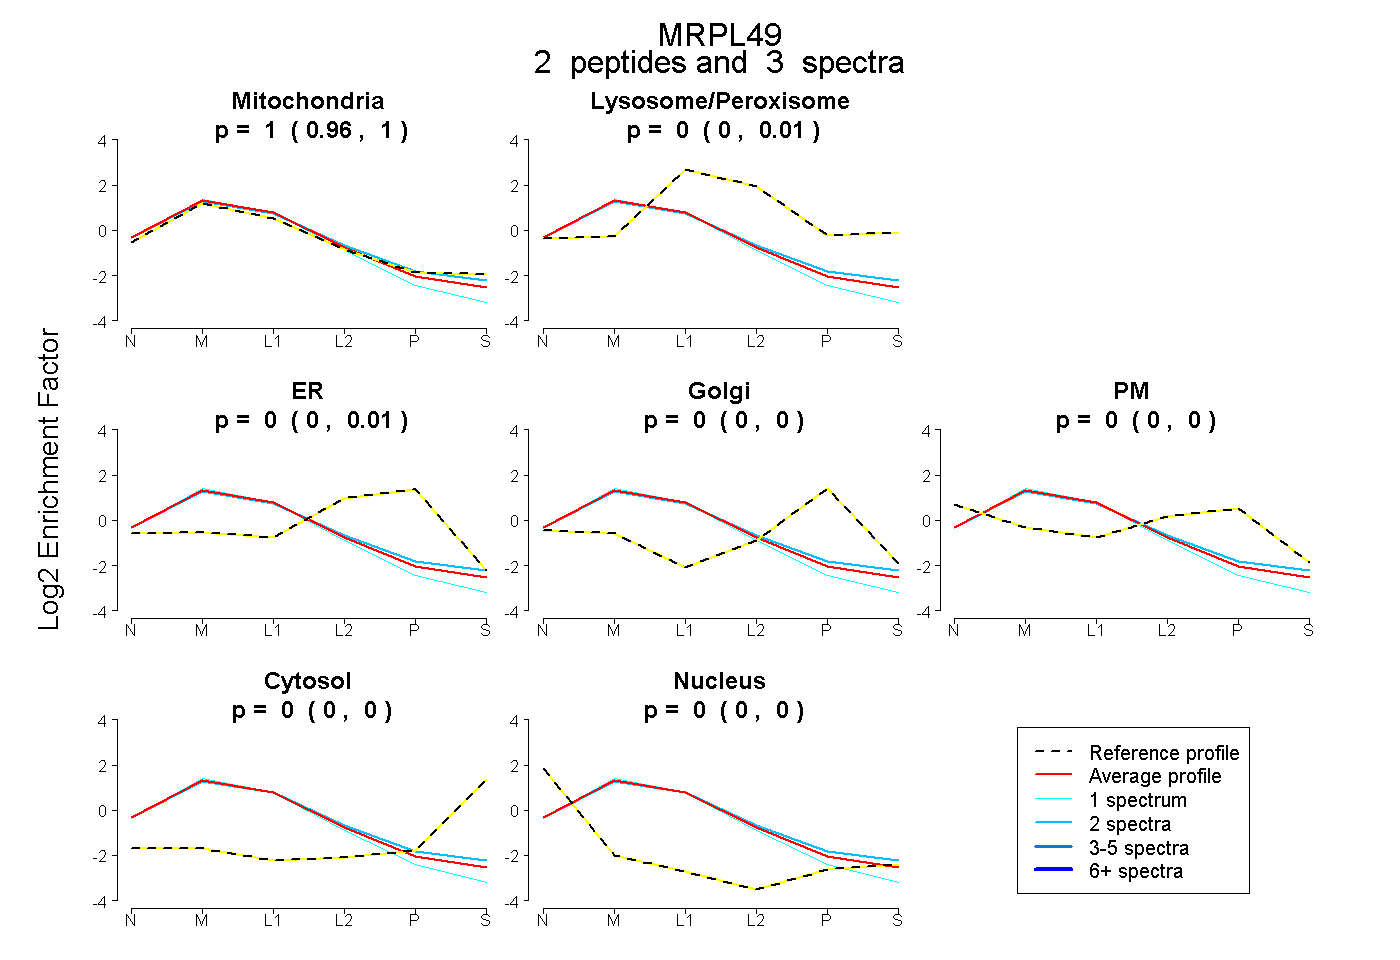 |
1.000 0.964 | 1.000 |
0.000 0.000 | 0.011 |
0.000 0.000 | 0.013 |
0.000 0.000 | 0.000 |
0.000 0.000 | 0.000 |
0.000 0.000 | 0.000 |
0.000 0.000 | 0.000 |
|||
| Plot | Lyso | Other | |||||||||||
| Expt C |
10 peptides |
20 spectra |
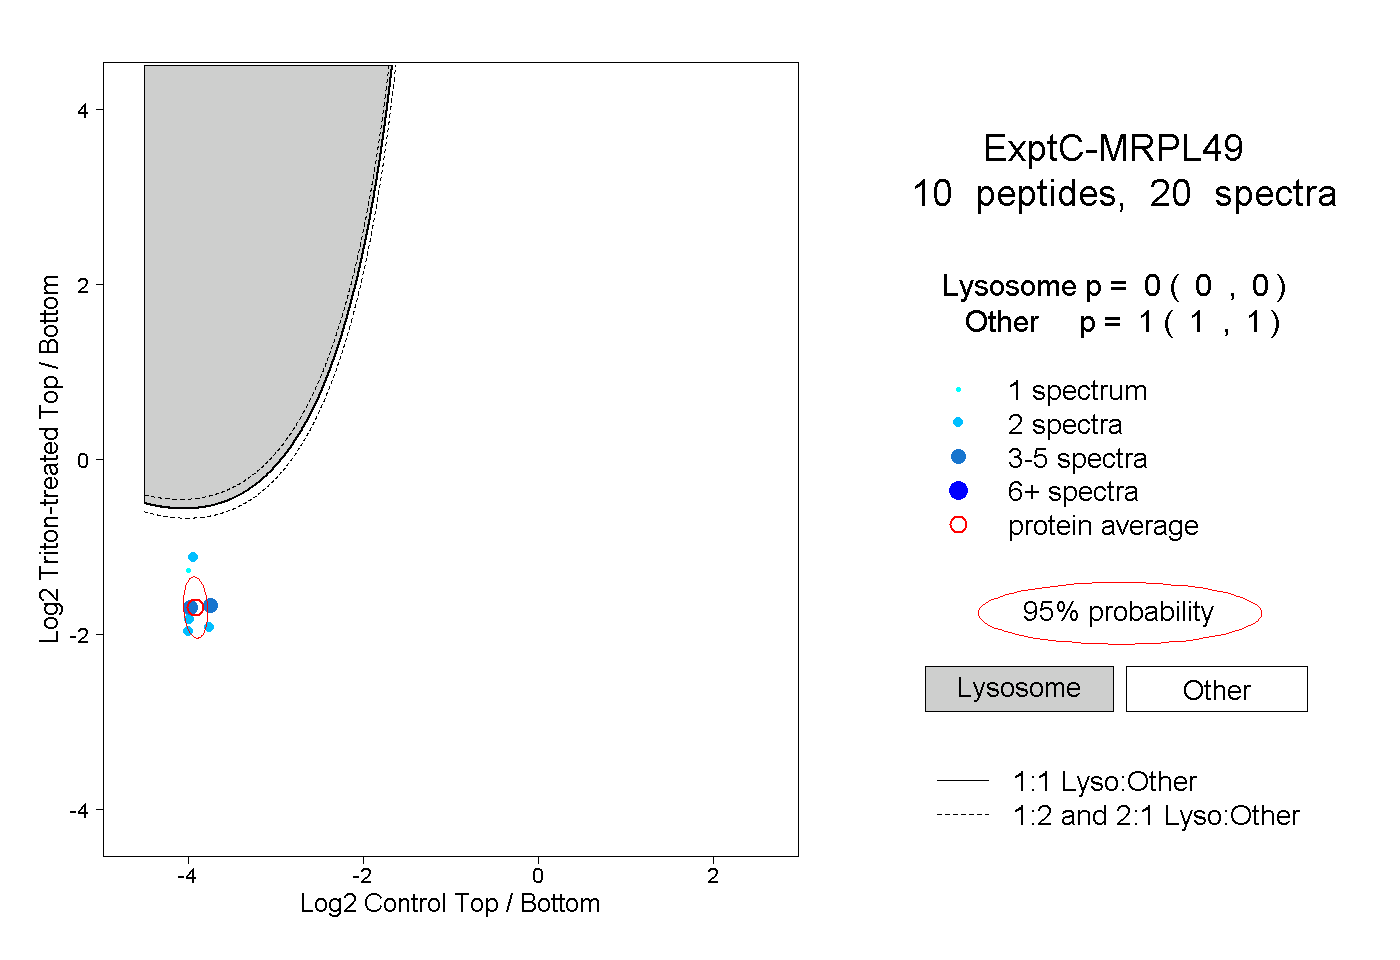 |
0.000 0.000 | 0.000 |
1.000 1.000 | 1.000 |
||||||||
| Plot | Lyso | Other | |||||||||||
| Expt D |
1 peptide |
1 spectrum |
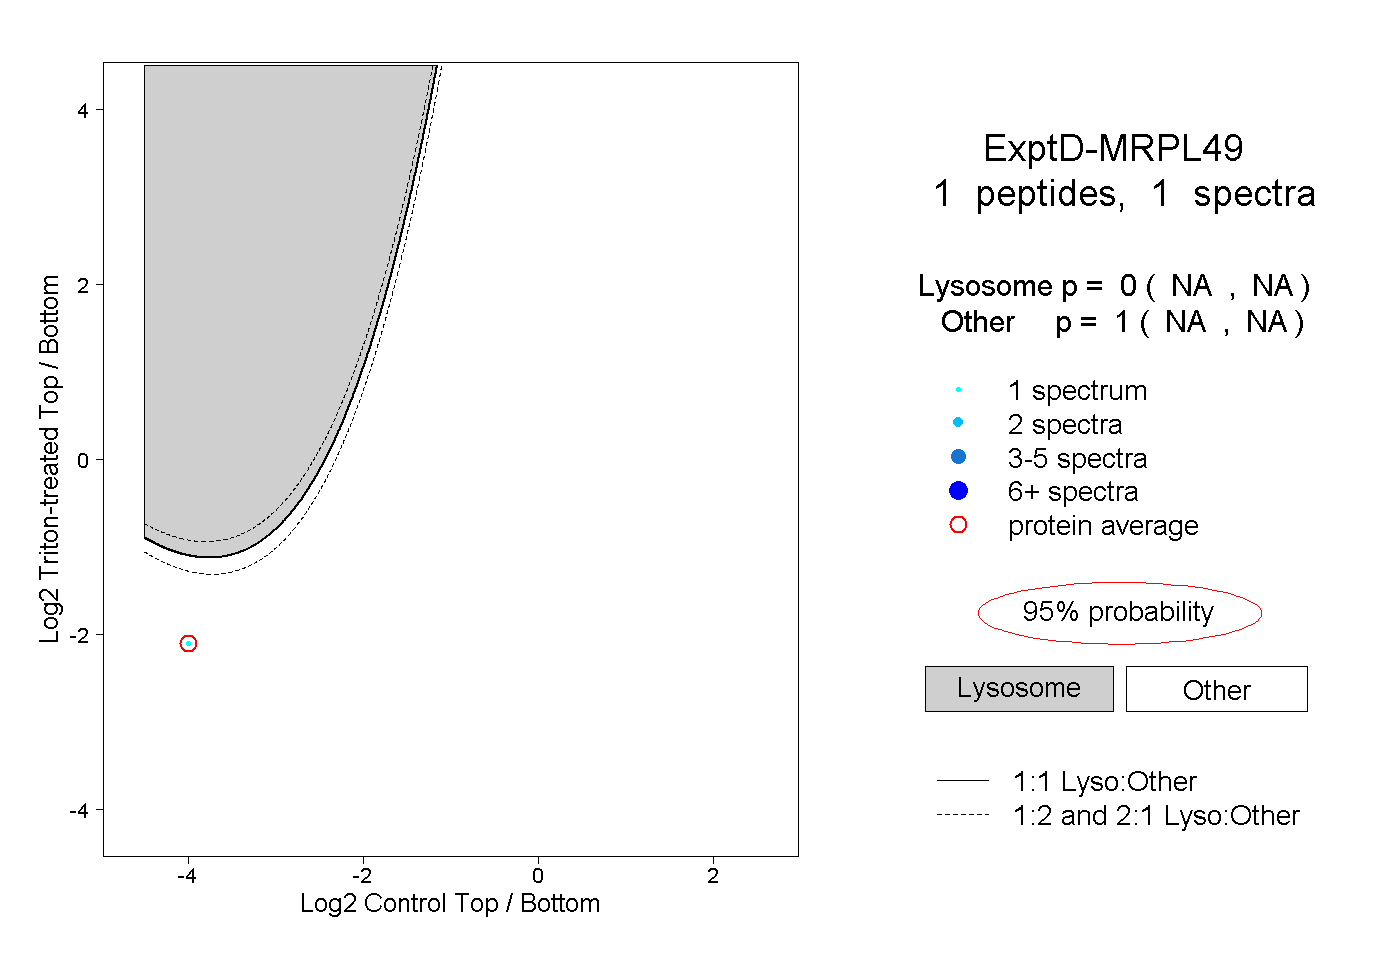 |
0.000 NA | NA |
1.000 NA | NA |