 11
11peptides
spectra
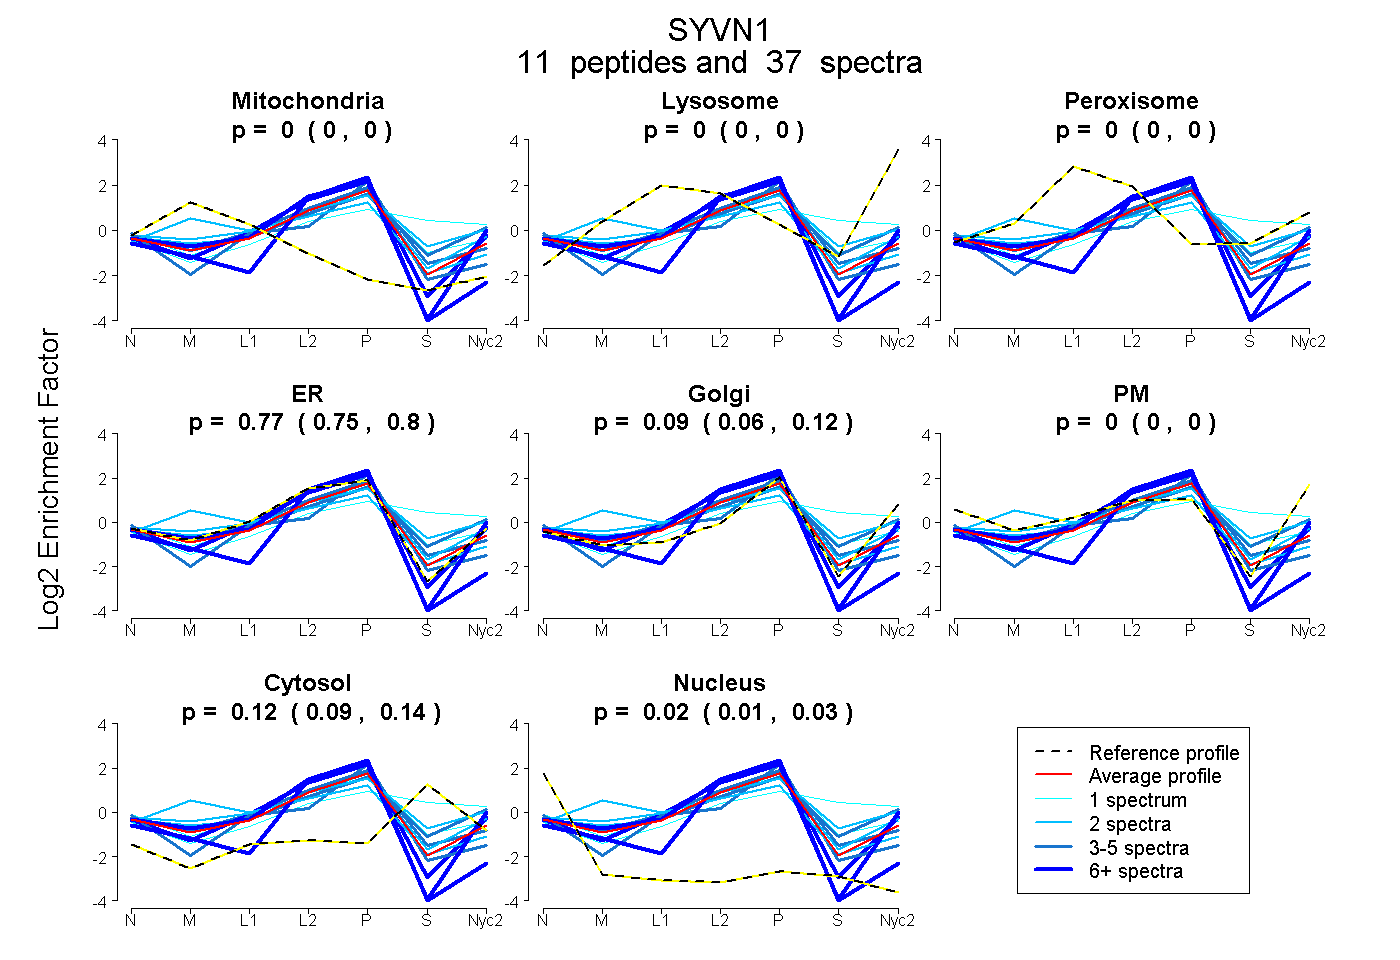
0.000 | 0.000
0.000 | 0.000
0.000 | 0.000
0.745 | 0.796
0.058 | 0.118
0.000 | 0.000
0.093 | 0.137
0.007 | 0.031
4peptides
spectra
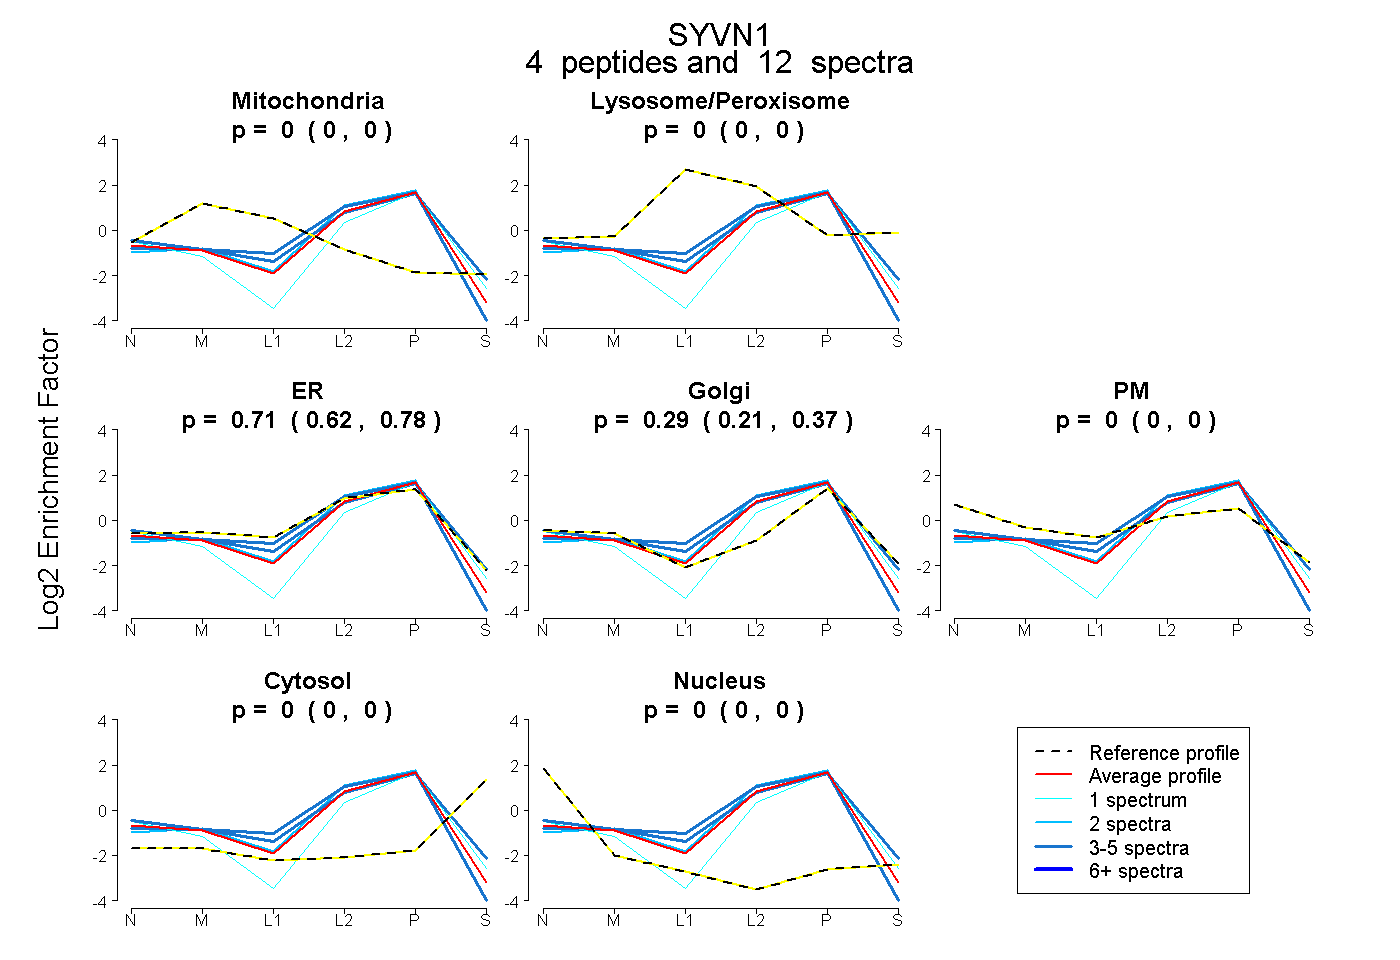
0.000 | 0.000
0.000 | 0.000
0.622 | 0.778
0.213 | 0.368
0.000 | 0.000
0.000 | 0.000
0.000 | 0.000
9peptides
spectra
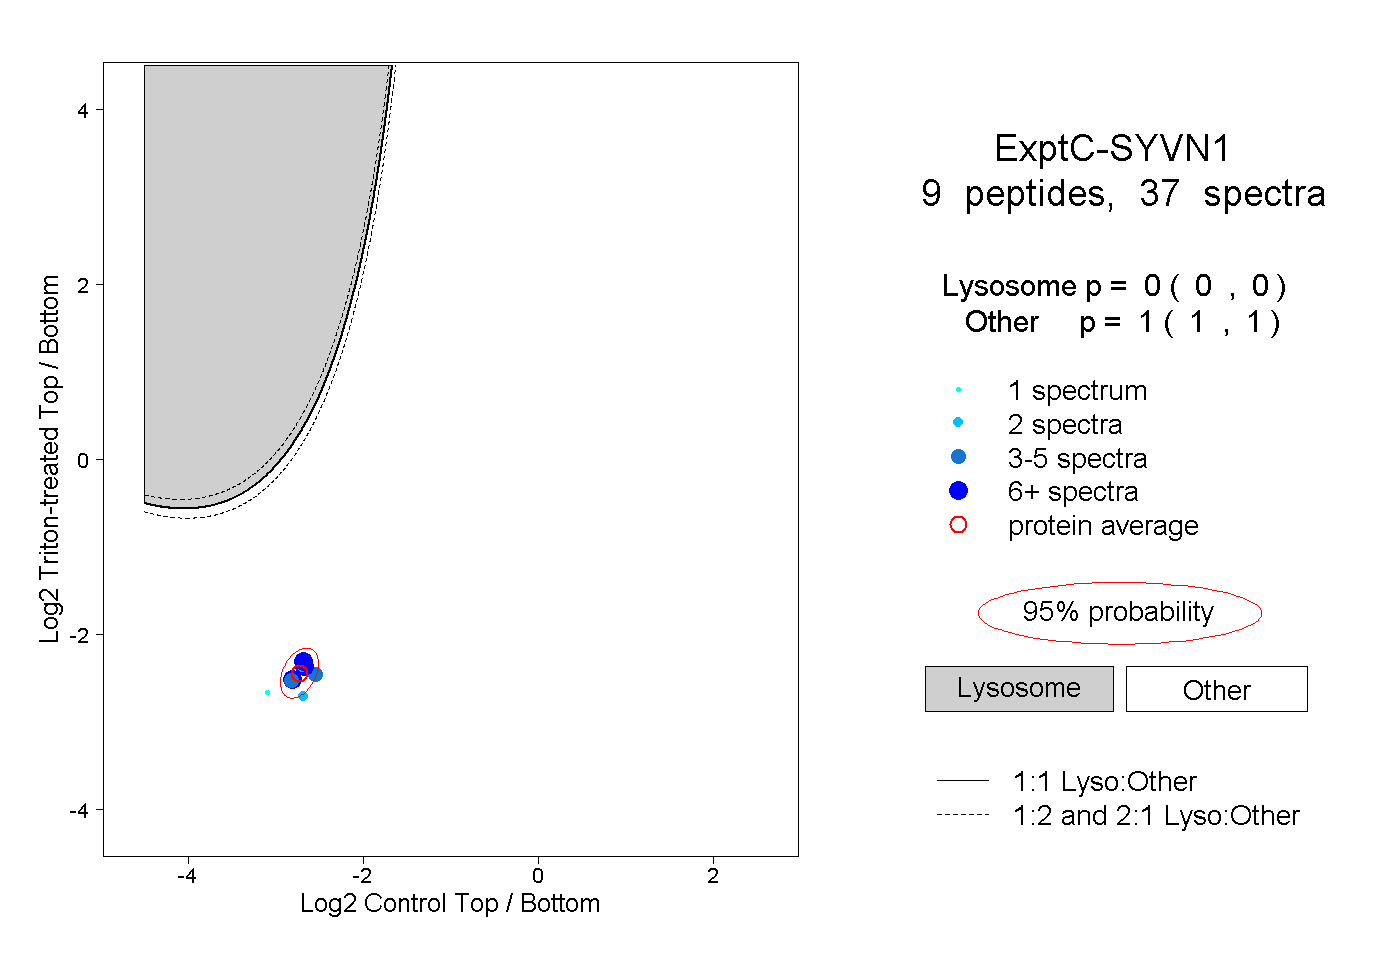
0.000 | 0.000
1.000 | 1.000