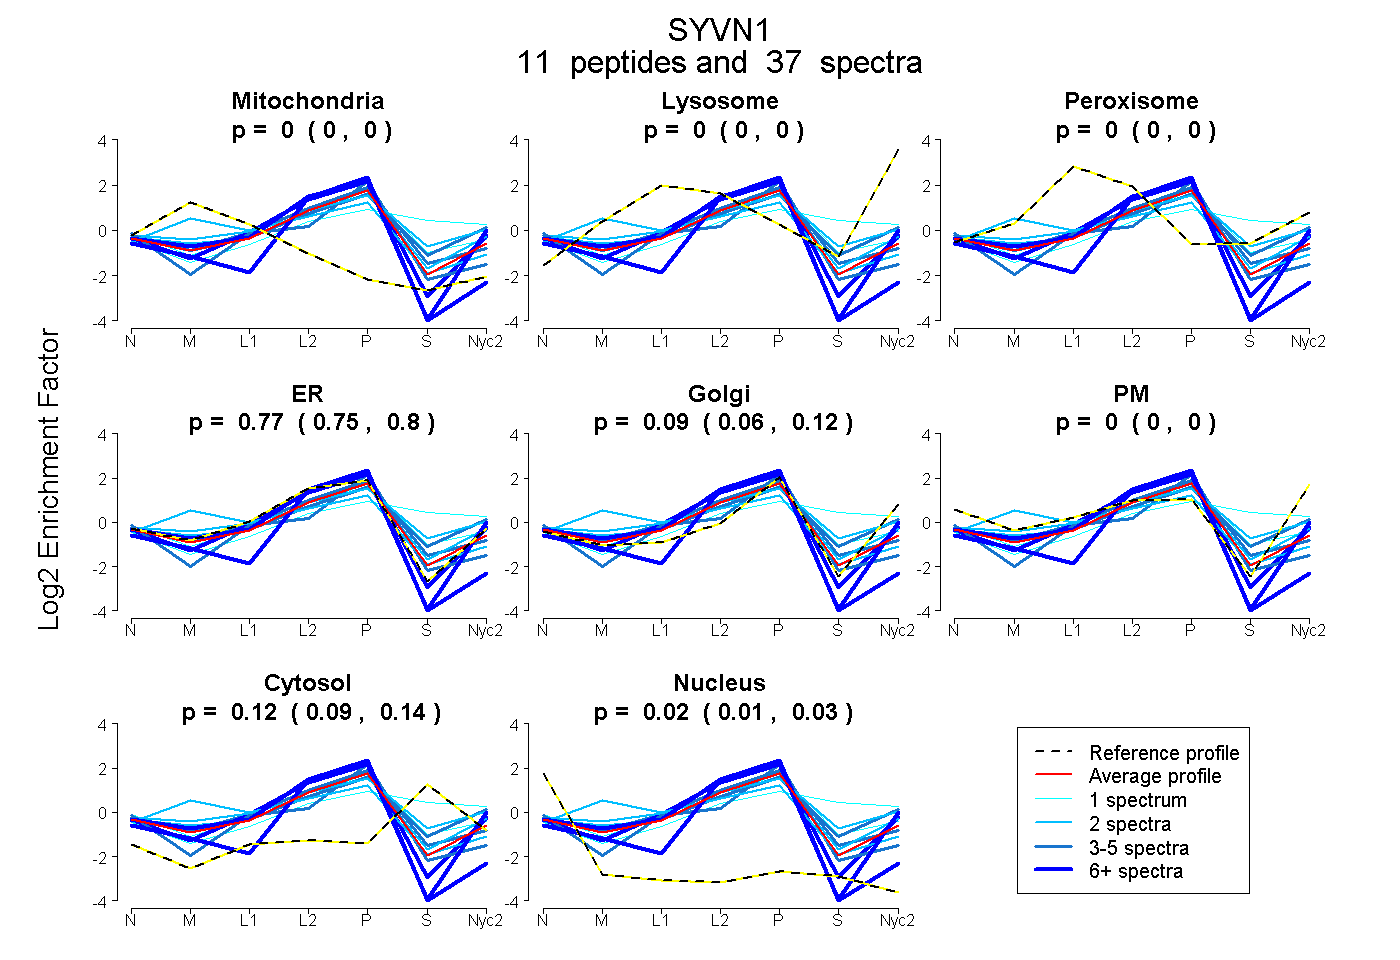
 11
11peptides
spectra
0.000 | 0.000
0.000 | 0.000
0.000 | 0.000
0.745 | 0.796
0.058 | 0.118
0.000 | 0.000
0.093 | 0.137
0.007 | 0.031
| Plot | Mito | Lyso | Perox | ER | Golgi | PM | Cytosol | Nucleus | |||||
| Expt A |
11 peptides |
37 spectra |
|
0.000 0.000 | 0.000 |
0.000 0.000 | 0.000 |
0.000 0.000 | 0.000 |
0.773 0.745 | 0.796 |
0.090 0.058 | 0.118 |
0.000 0.000 | 0.000 |
0.118 0.093 | 0.137 |
0.019 0.007 | 0.031 |
| 3 spectra, LESPVAH | 0.000 | 0.000 | 0.000 | 0.758 | 0.034 | 0.000 | 0.069 | 0.138 | ||
| 2 spectra, DDFSPR | 0.050 | 0.000 | 0.091 | 0.528 | 0.250 | 0.000 | 0.081 | 0.000 | ||
| 1 spectrum, EEMVTGAK | 0.000 | 0.113 | 0.000 | 0.263 | 0.085 | 0.068 | 0.470 | 0.000 | ||
| 4 spectra, AAEMEHLLER | 0.000 | 0.000 | 0.000 | 0.831 | 0.000 | 0.000 | 0.169 | 0.000 | ||
| 6 spectra, VFFGQLR | 0.000 | 0.000 | 0.000 | 0.897 | 0.103 | 0.000 | 0.000 | 0.000 | ||
| 3 spectra, HQFYPTVVYLTK | 0.000 | 0.000 | 0.110 | 0.387 | 0.337 | 0.000 | 0.165 | 0.000 | ||
| 6 spectra, AVTDAIMSR | 0.000 | 0.000 | 0.000 | 0.874 | 0.125 | 0.000 | 0.000 | 0.001 | ||
| 7 spectra, QQTCPTCR | 0.000 | 0.000 | 0.000 | 0.840 | 0.000 | 0.000 | 0.000 | 0.160 | ||
| 2 spectra, QHLEAR | 0.000 | 0.000 | 0.144 | 0.409 | 0.256 | 0.000 | 0.191 | 0.000 | ||
| 1 spectrum, ALEGHER | 0.000 | 0.000 | 0.010 | 0.662 | 0.096 | 0.000 | 0.232 | 0.000 | ||
| 2 spectra, LPCNHIFHTSCLR | 0.285 | 0.000 | 0.015 | 0.667 | 0.010 | 0.000 | 0.023 | 0.000 |
| Plot | Mito | Lyso or Perox | ER | Golgi | PM | Cytosol | Nucleus | ||||||
| Expt B |
4 peptides |
12 spectra |
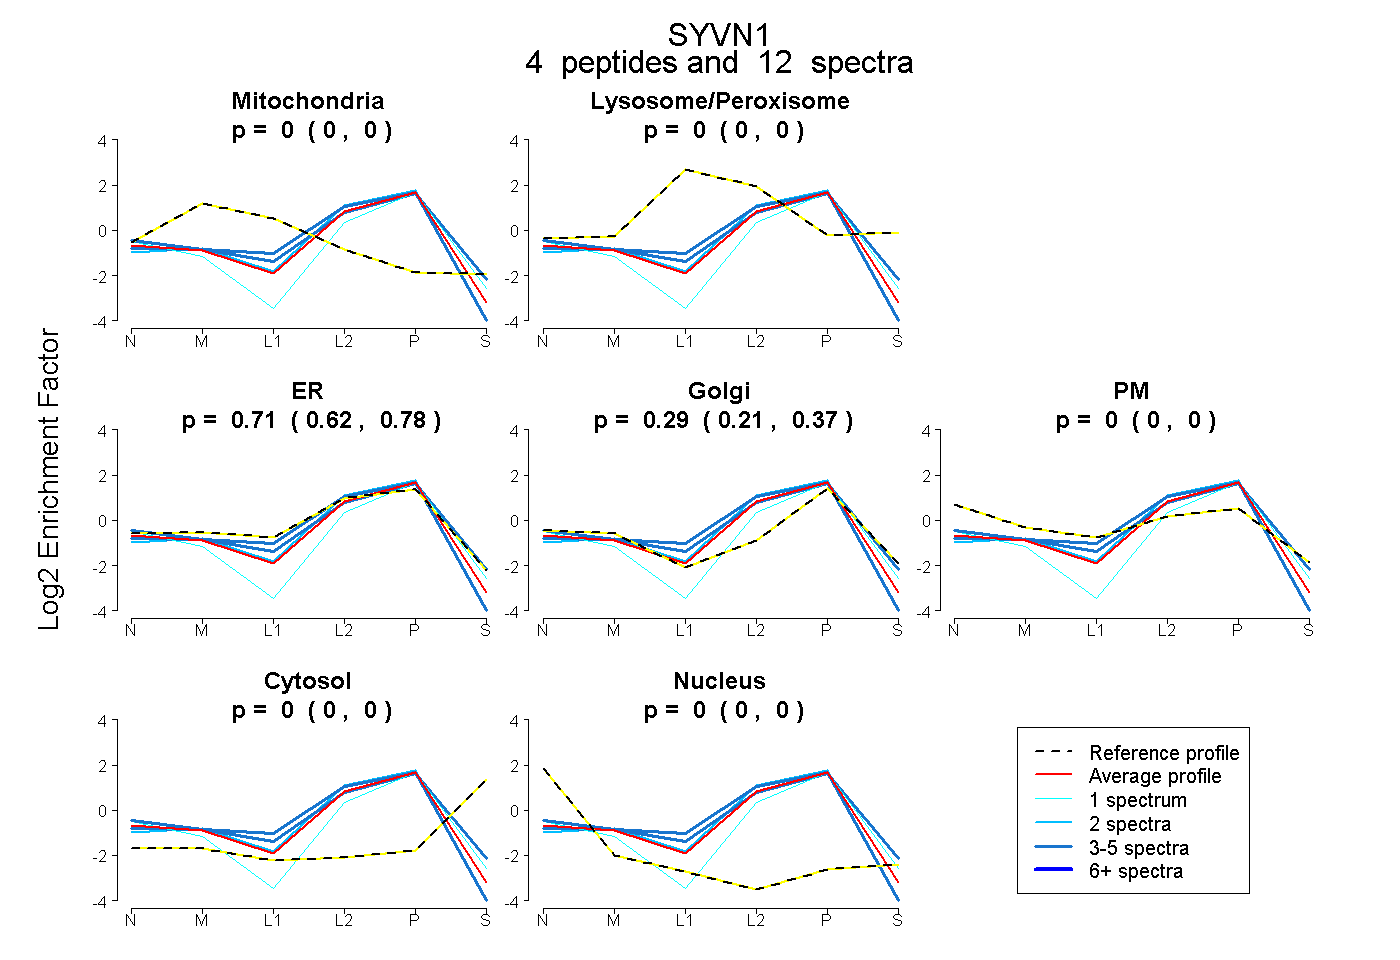 |
0.000 0.000 | 0.000 |
0.000 0.000 | 0.000 |
0.707 0.622 | 0.778 |
0.293 0.213 | 0.368 |
0.000 0.000 | 0.000 |
0.000 0.000 | 0.000 |
0.000 0.000 | 0.000 |
|||
| Plot | Lyso | Other | |||||||||||
| Expt C |
9 peptides |
37 spectra |
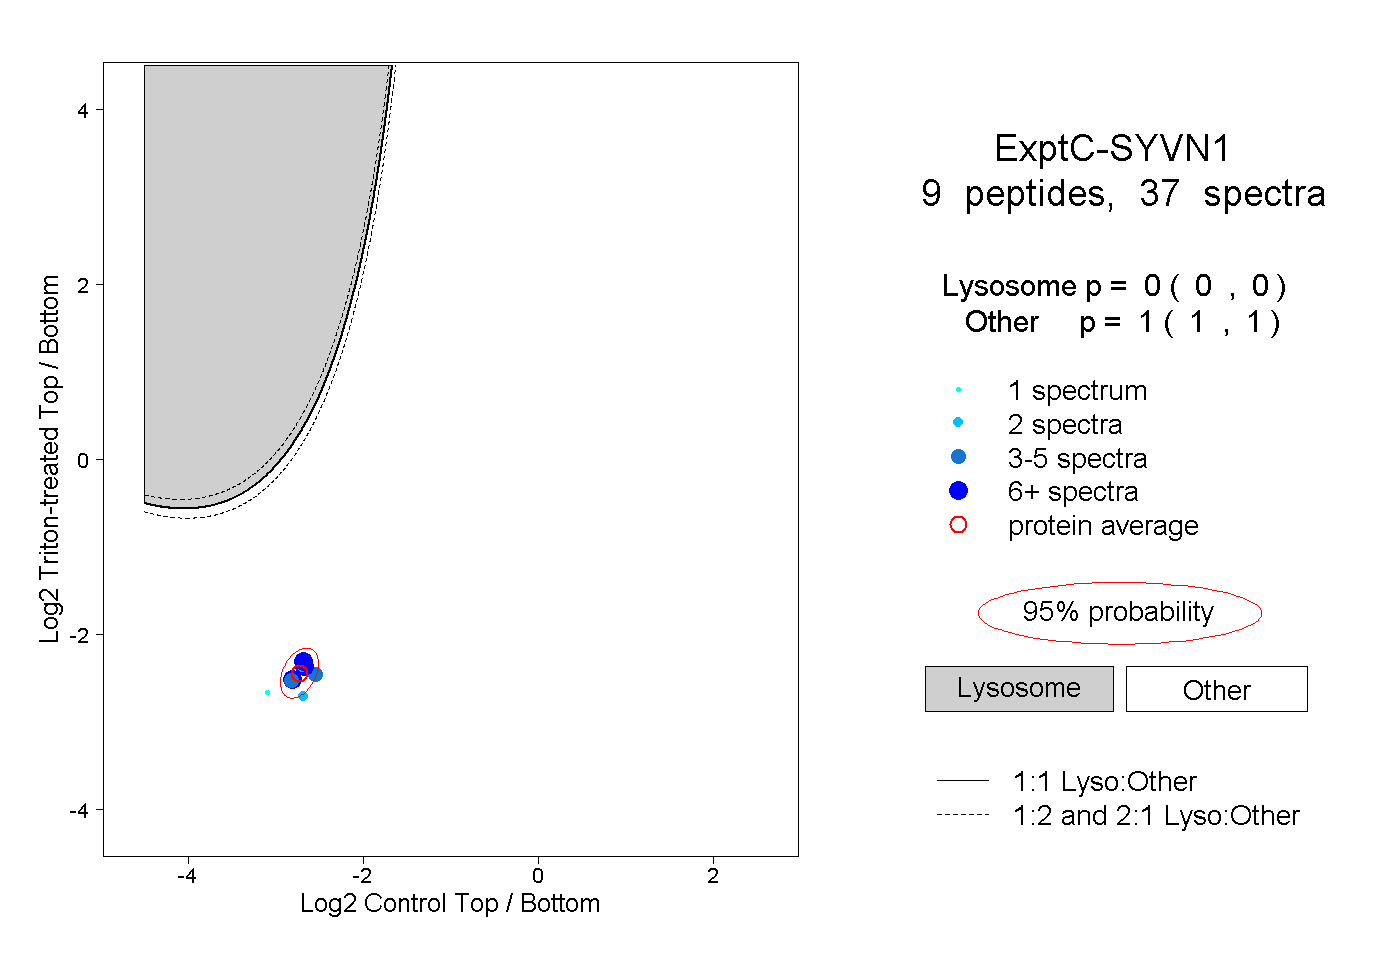 |
0.000 0.000 | 0.000 |
1.000 1.000 | 1.000 |