 37
37peptides
spectra
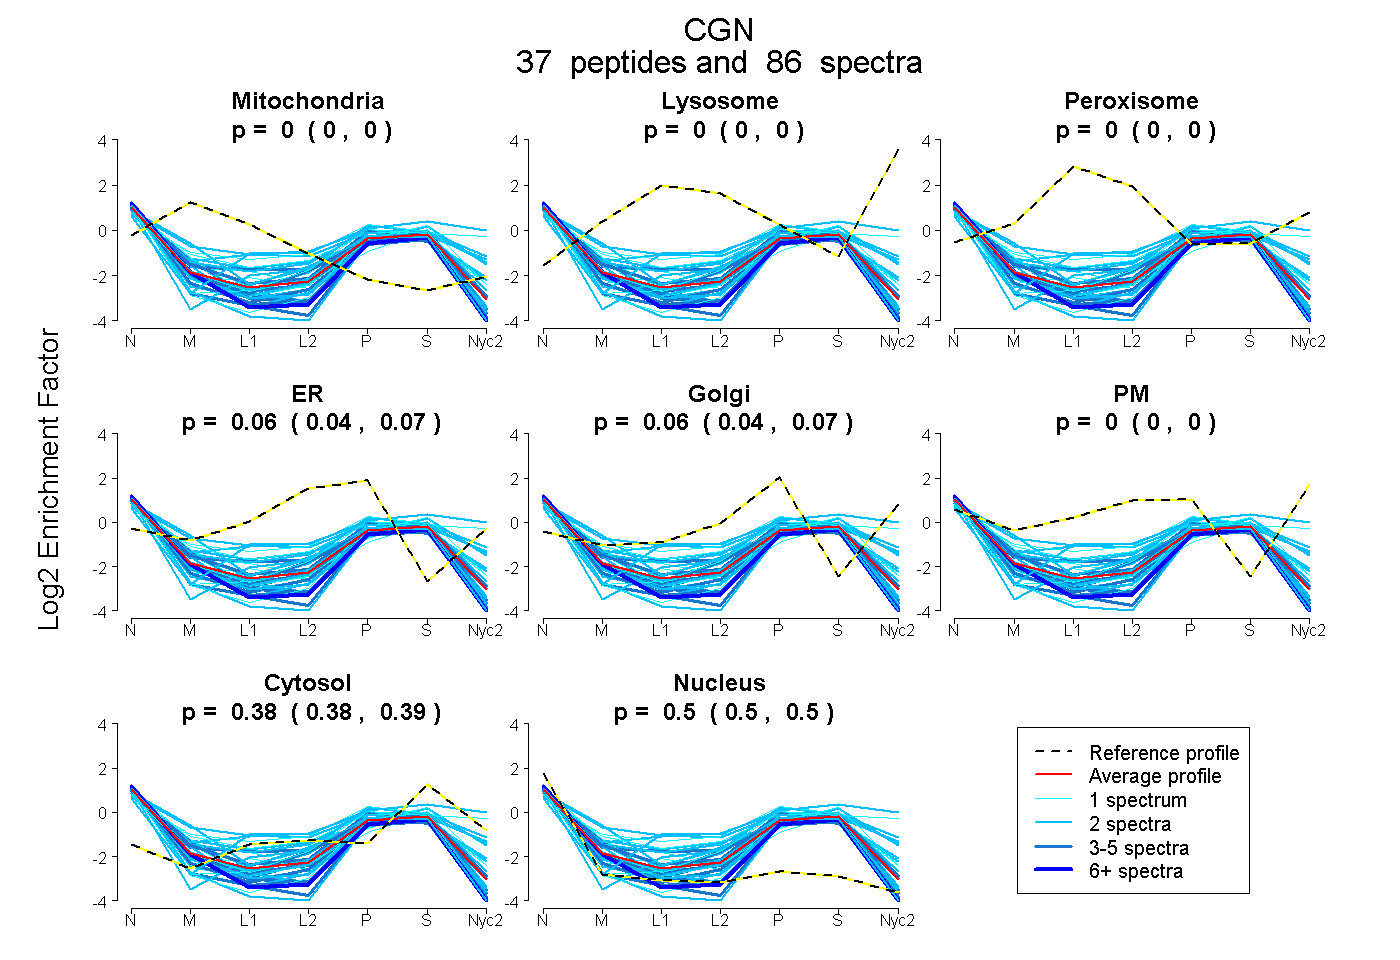
0.000 | 0.000
0.000 | 0.000
0.000 | 0.000
0.041 | 0.067
0.045 | 0.075
0.000 | 0.000
0.383 | 0.386
0.496 | 0.502
11peptides
spectra
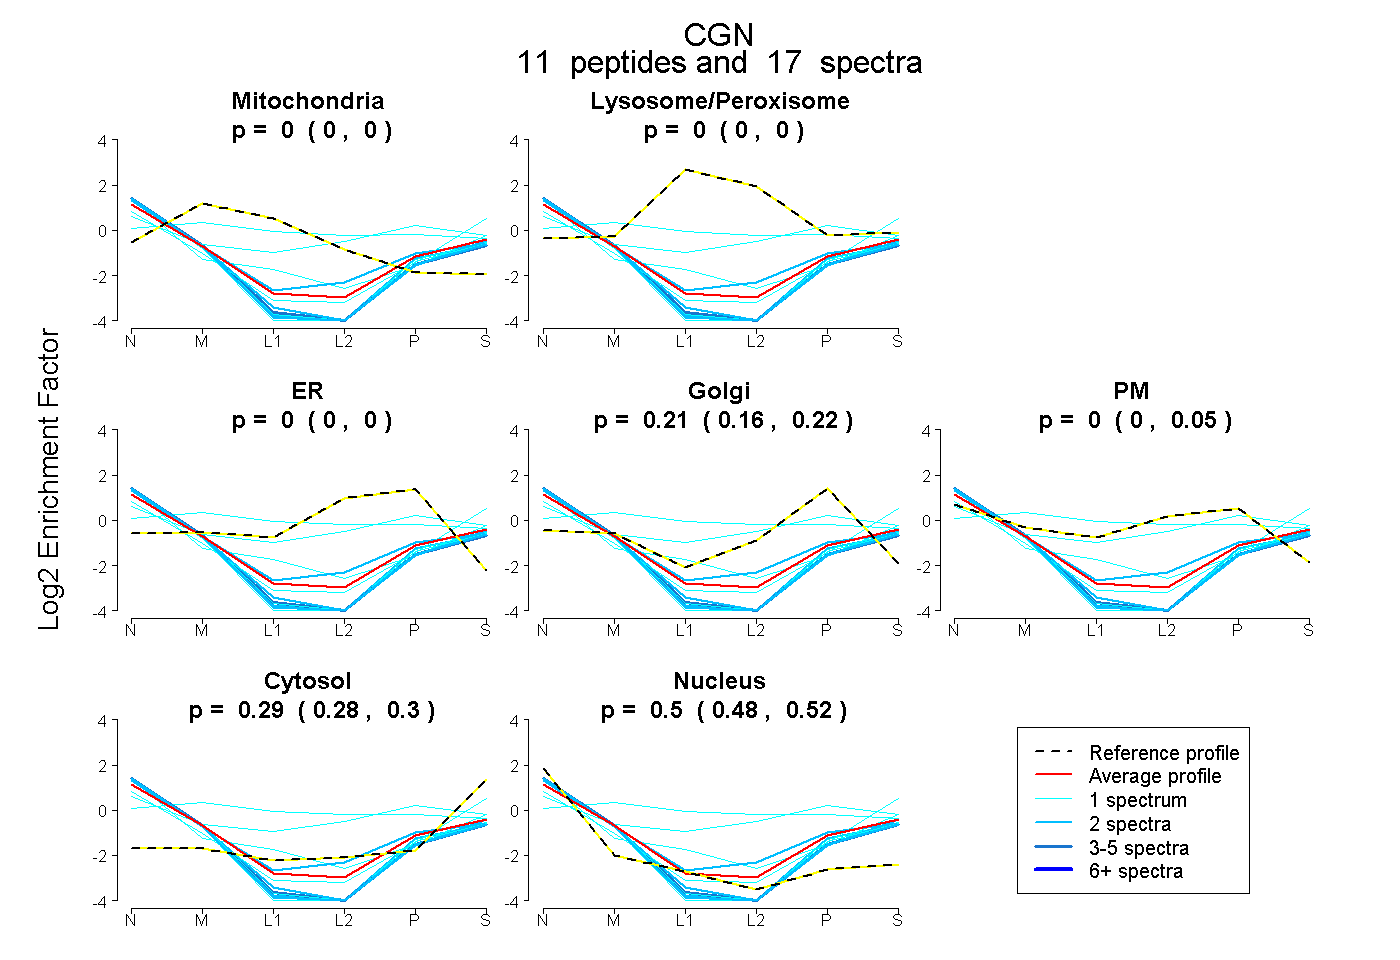
0.000 | 0.000
0.000 | 0.000
0.000 | 0.000
0.158 | 0.221
0.000 | 0.046
0.279 | 0.302
0.476 | 0.520
12peptides
spectra
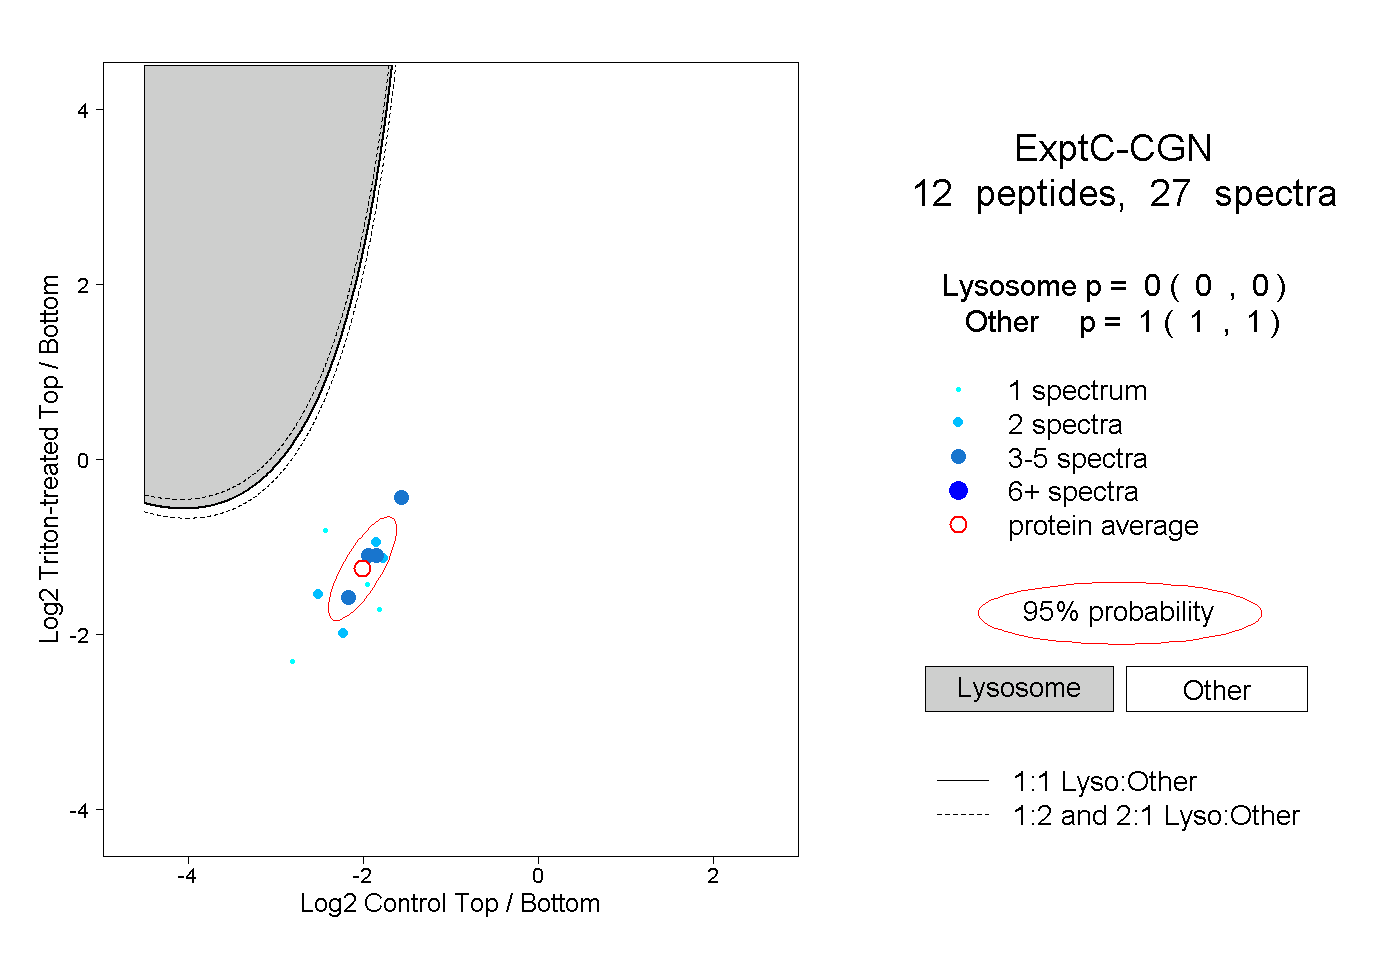
0.000 | 0.000
1.000 | 1.000
1peptide
spectrum
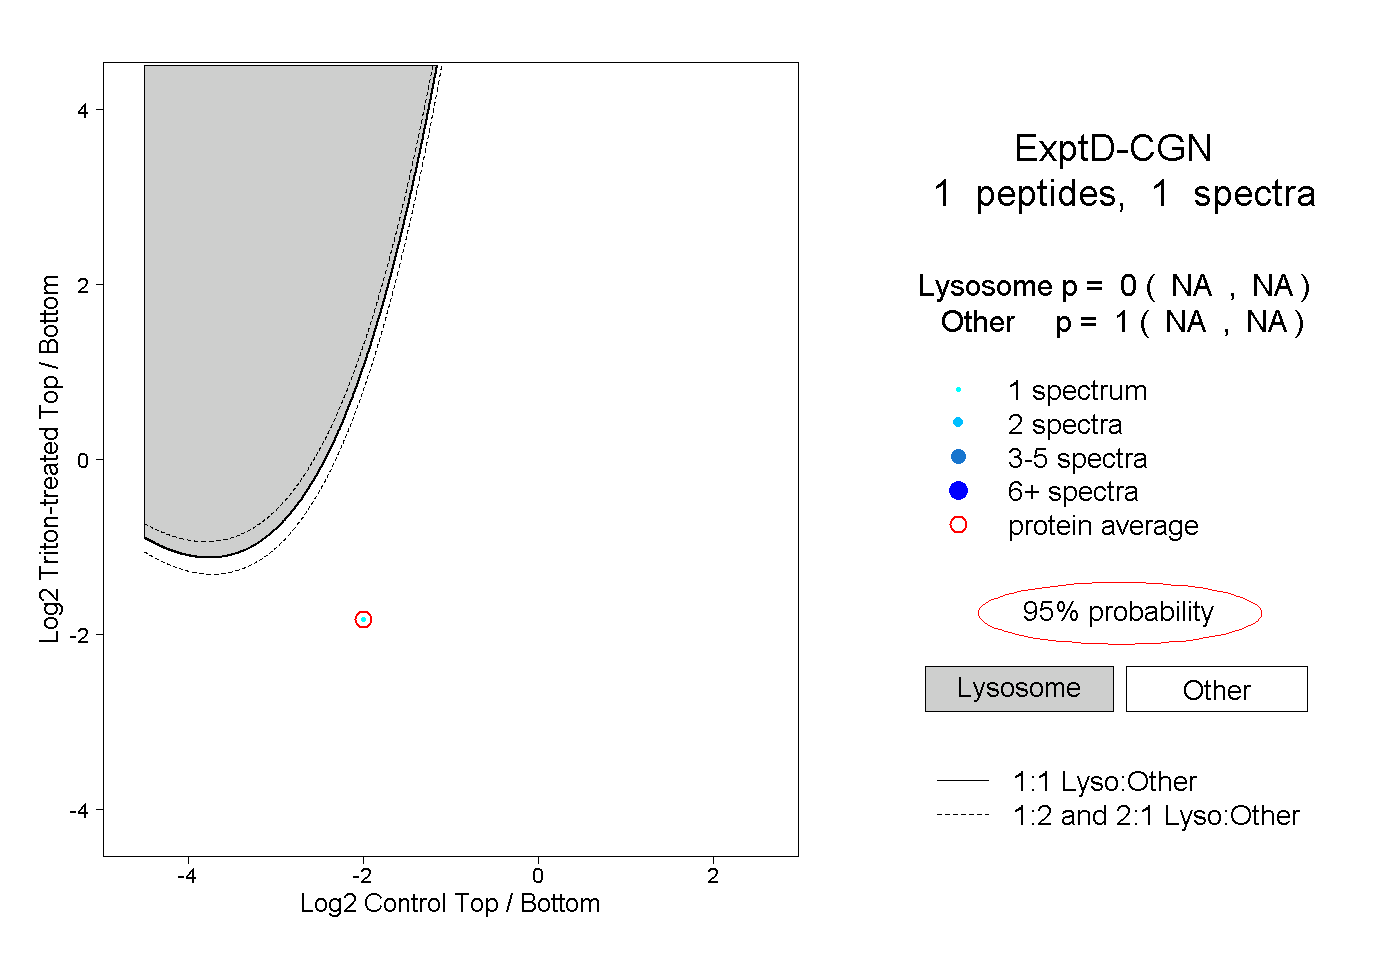
NA | NA
NA | NA