CGN
[ENSRNOP00000028440]
Main page
| | | Plot |
Mito |
Lyso |
|
Perox |
ER |
Golgi |
PM |
Cytosol |
Nucleus |
|
| Expt A |
 37
37
peptides |
86
spectra |
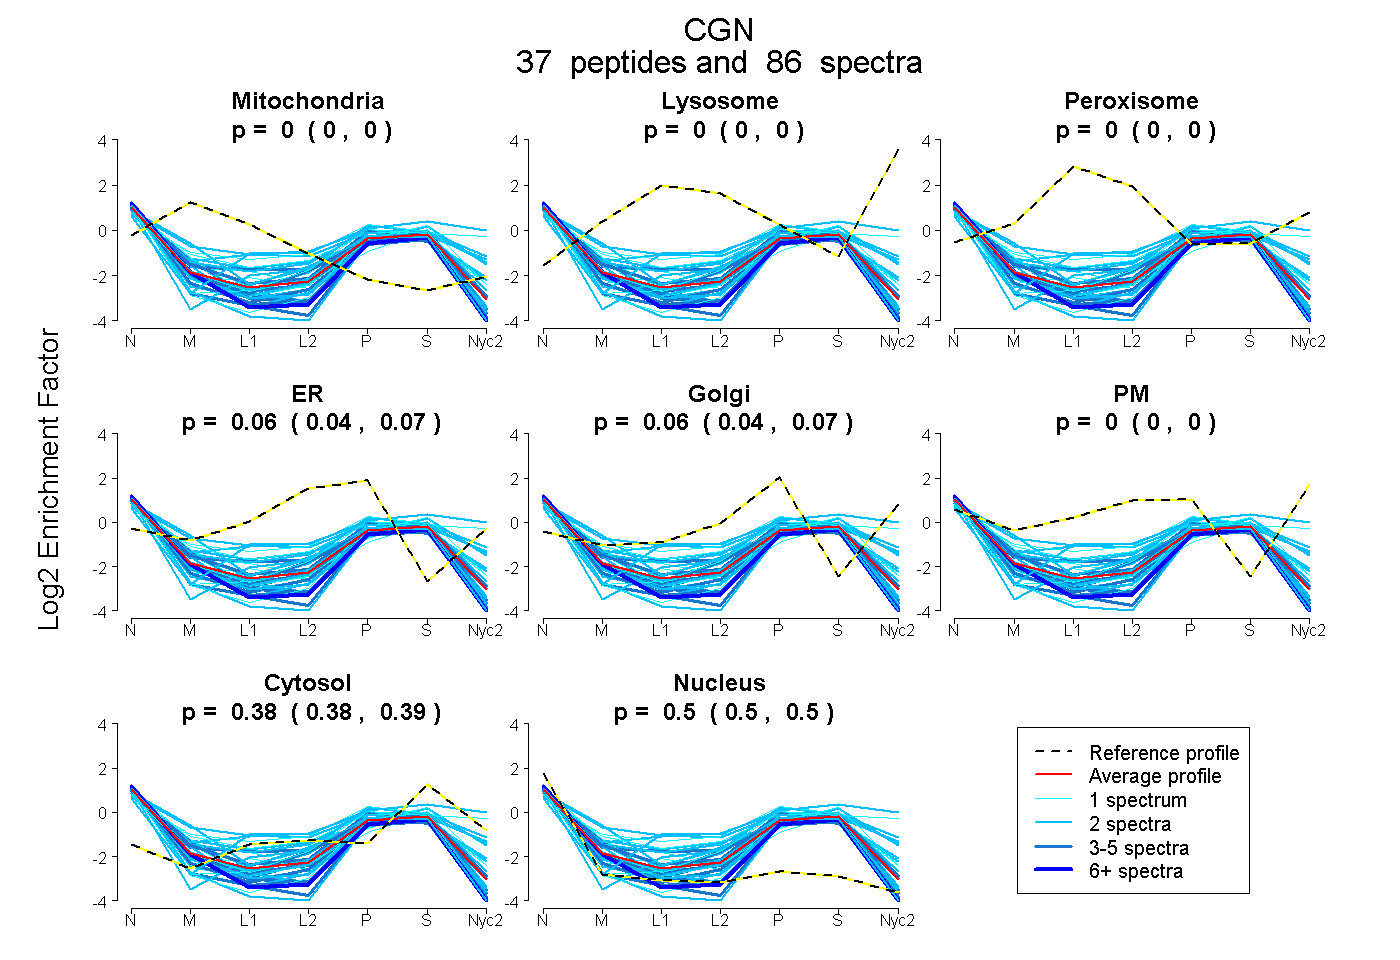 |
0.000
0.000 | 0.000 |
0.000
0.000 | 0.000 |
|
0.000
0.000 | 0.000 |
0.055
0.041 | 0.067 |
0.061
0.045 | 0.075 |
0.000
0.000 | 0.000 |
0.384
0.383 | 0.386 |
0.499
0.496 | 0.502 |
|
| | | Plot |
Mito |
|
Lyso or Perox |
|
ER |
Golgi |
PM |
Cytosol |
Nucleus |
|
| Expt B |
11
peptides |
17
spectra |
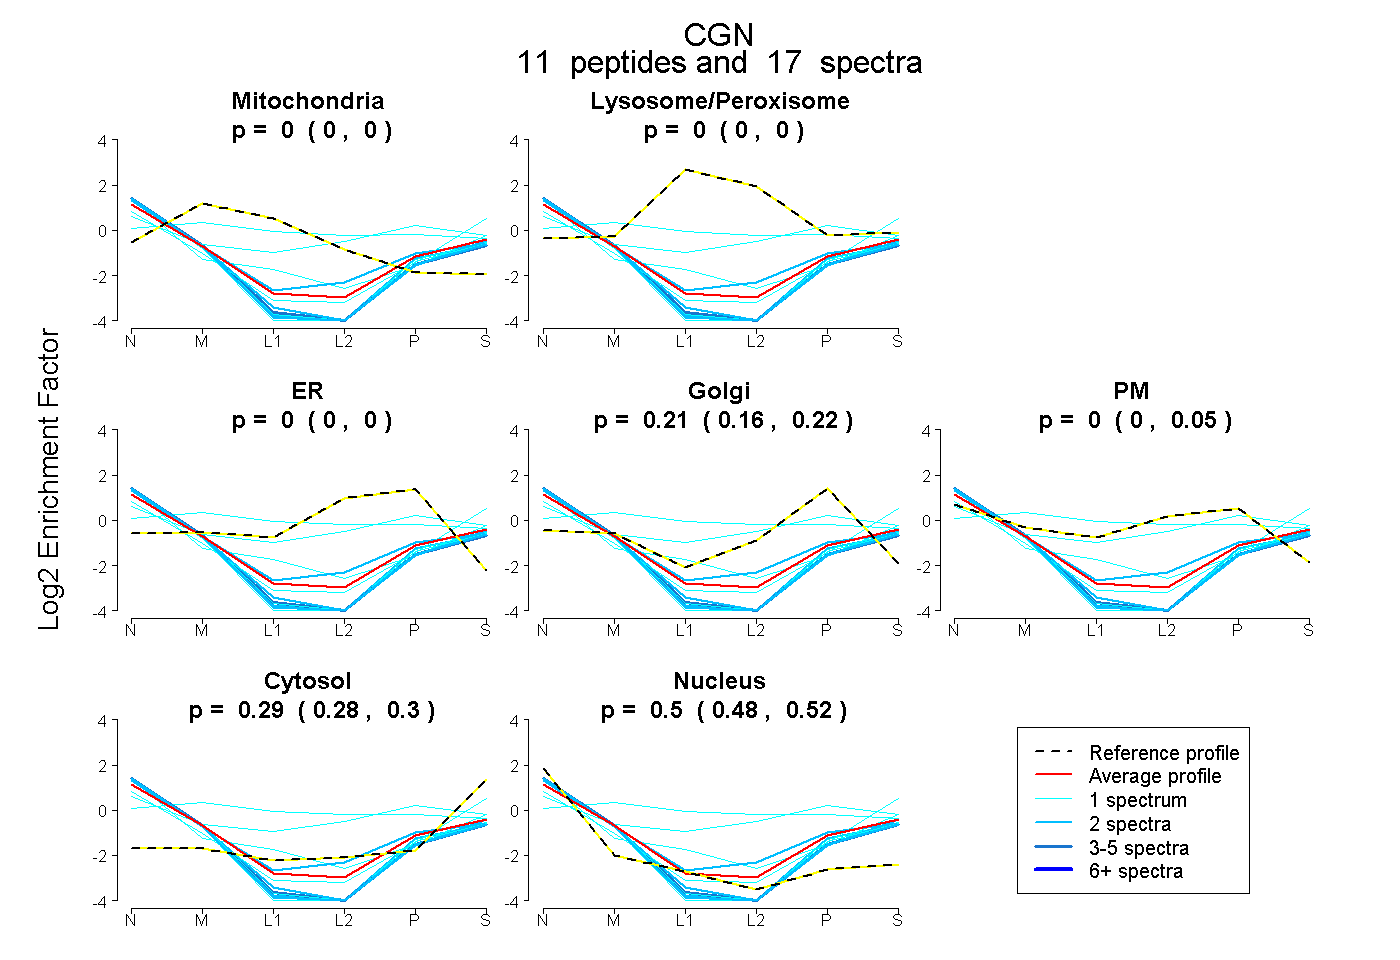 |
0.000
0.000 | 0.000 |
|
0.000
0.000 | 0.000 |
|
0.000
0.000 | 0.000 |
0.208
0.158 | 0.221 |
0.000
0.000 | 0.046 |
0.290
0.279 | 0.302 |
0.502
0.476 | 0.520 |
|
| | | Plot |
|
Lyso |
|
|
|
|
|
|
|
Other |
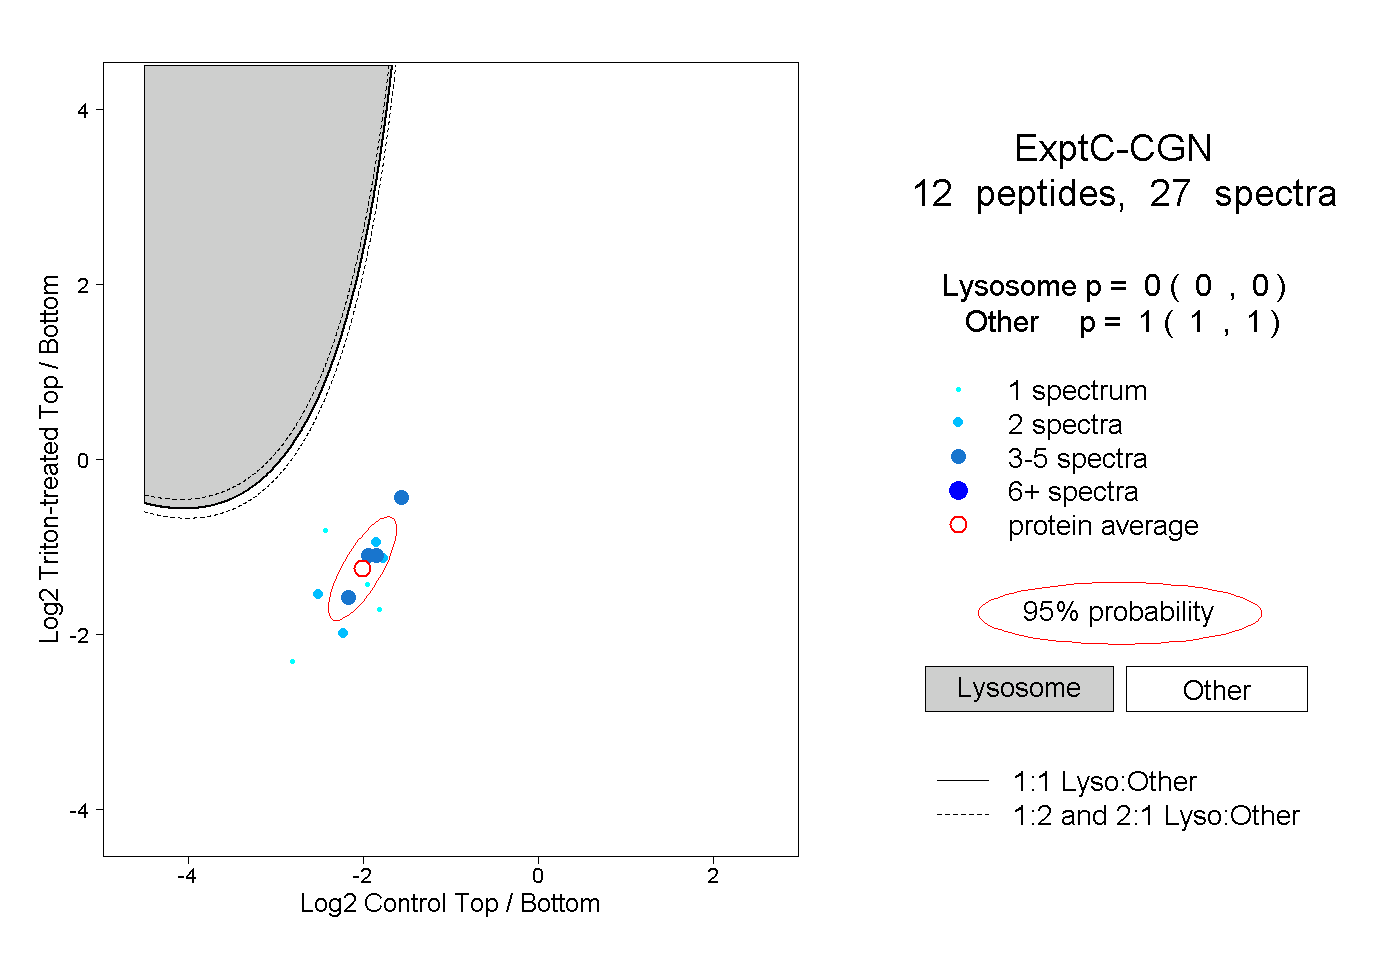
| Expt C |
12
peptides |
27
spectra |
 |
|
0.000
0.000 | 0.000 |
|
|
|
|
|
|
|
1.000
1.000 | 1.000 |
| 5 spectra, LGQEQQALNR |
|
0.000 |
|
|
|
|
|
|
|
1.000 |
| 2 spectra, LQDELQR |
|
0.000 |
|
|
|
|
|
|
|
1.000 |
| 2 spectra, ELTAIK |
|
0.000 |
|
|
|
|
|
|
|
1.000 |
| 1 spectrum, ELLEELLEGK |
|
0.000 |
|
|
|
|
|
|
|
1.000 |
| 2 spectra, DQLTLR |
|
0.000 |
|
|
|
|
|
|
|
1.000 |
| 1 spectrum, LQGLEQEAENK |
|
0.000 |
|
|
|
|
|
|
|
1.000 |
| 3 spectra, QALQTSQAER |
|
0.000 |
|
|
|
|
|
|
|
1.000 |
| 2 spectra, GLVEGGEAVEAR |
|
0.000 |
|
|
|
|
|
|
|
1.000 |
| 1 spectrum, TLPQEQQR |
|
0.000 |
|
|
|
|
|
|
|
1.000 |
| 4 spectra, QDCEEASK |
|
0.000 |
|
|
|
|
|
|
|
1.000 |
| 1 spectrum, DLLETR |
|
0.000 |
|
|
|
|
|
|
|
1.000 |
| 3 spectra, LLLGQEEGLR |
|
0.000 |
|
|
|
|
|
|
|
1.000 |
| | | Plot |
|
Lyso |
|
|
|
|
|
|
|
Other |
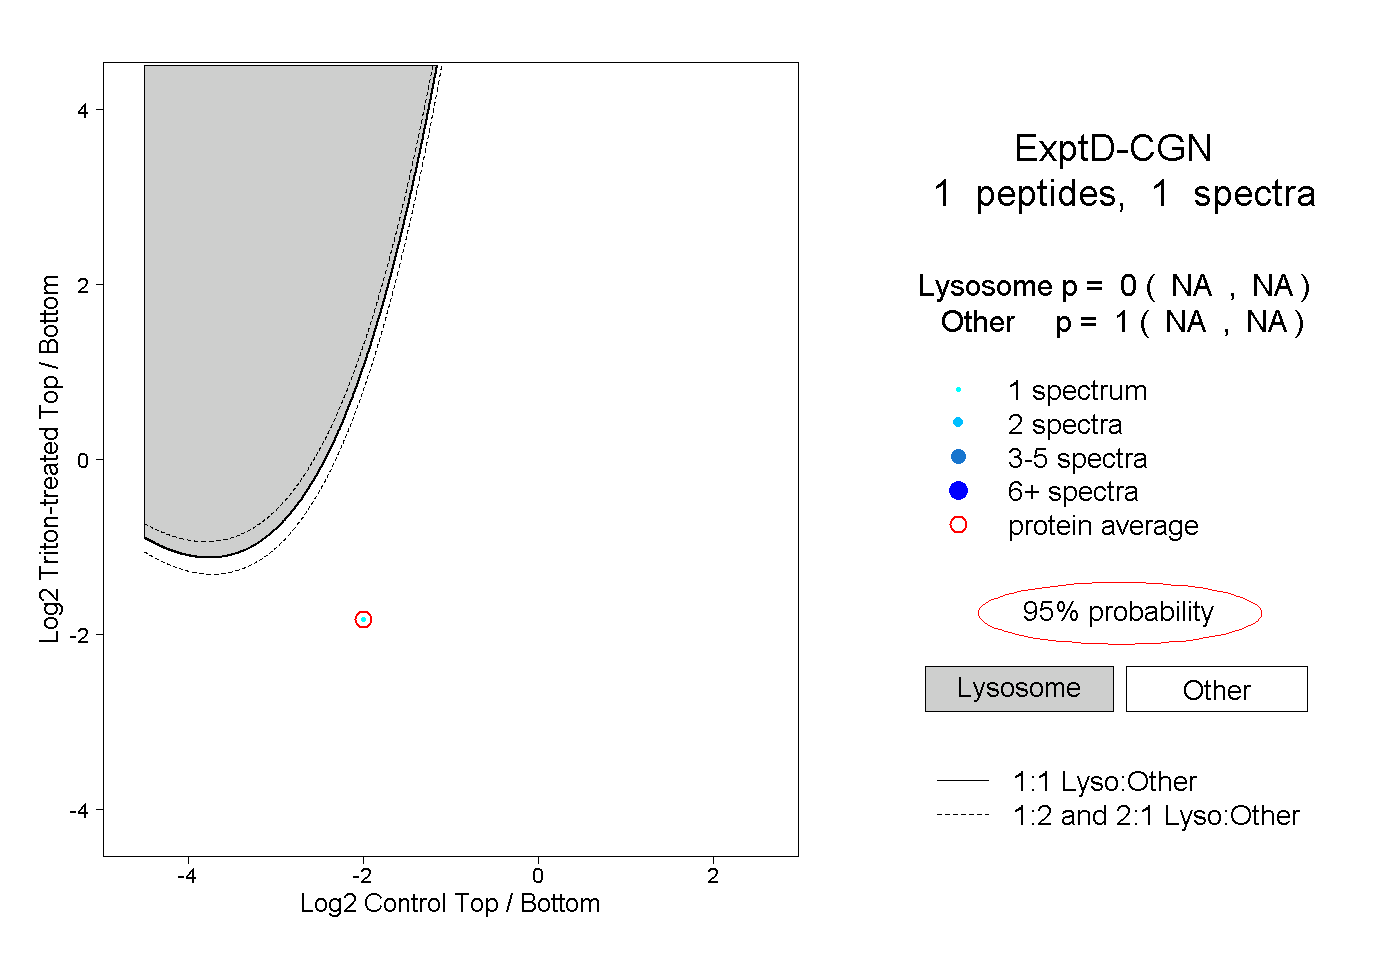
| Expt D |
1
peptide |
1
spectrum |
 |
|
0.000
NA | NA |
|
|
|
|
|
|
|
1.000
NA | NA |