 8
8peptides
spectra
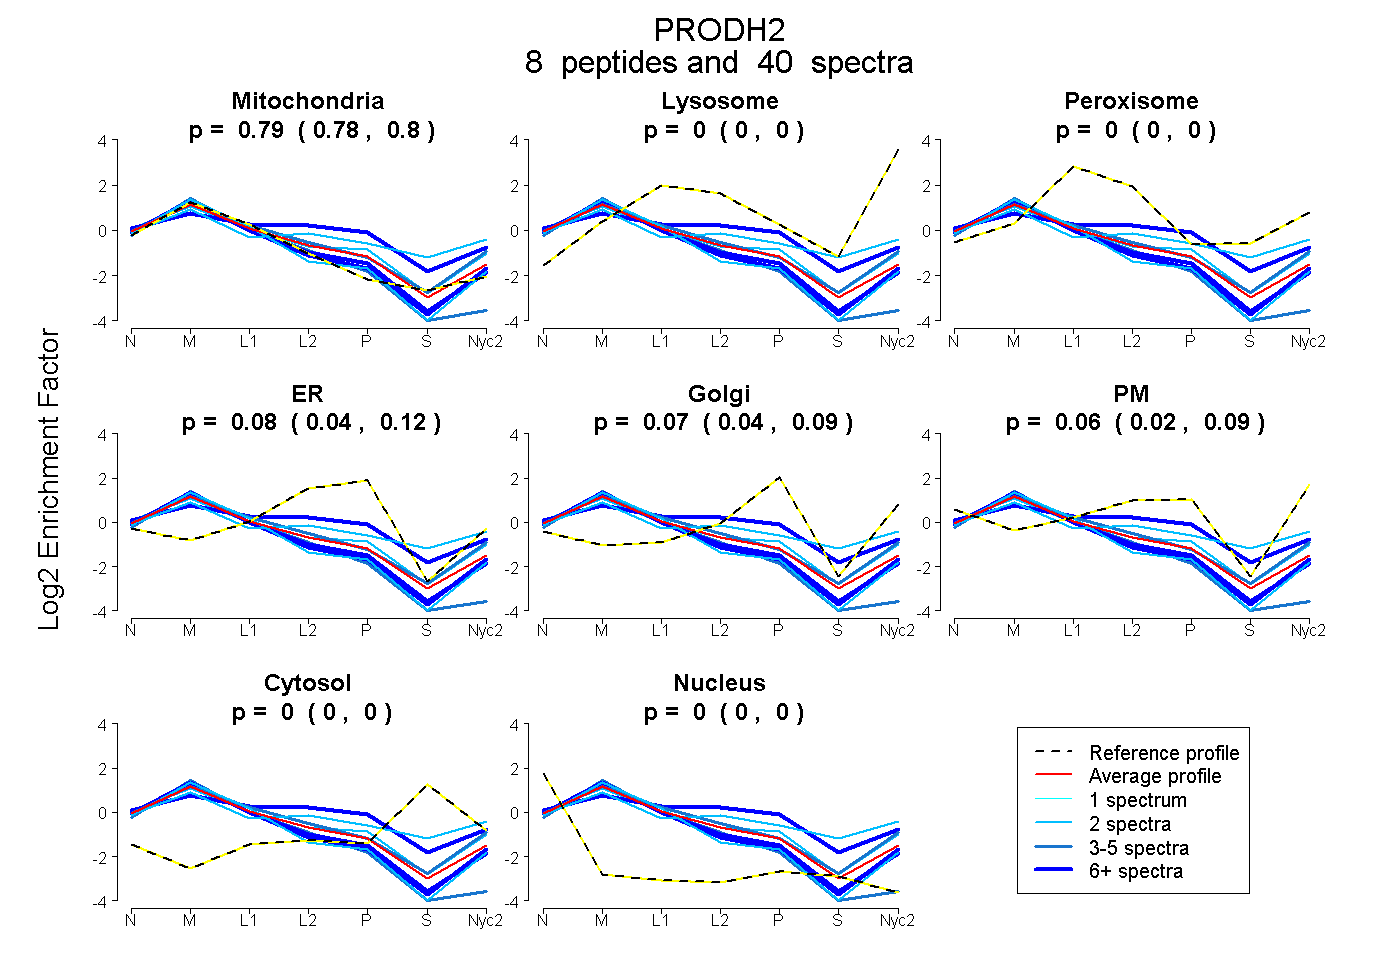
0.778 | 0.803
0.000 | 0.000
0.000 | 0.000
0.045 | 0.117
0.043 | 0.090
0.019 | 0.088
0.000 | 0.000
0.000 | 0.000
5peptides
spectra
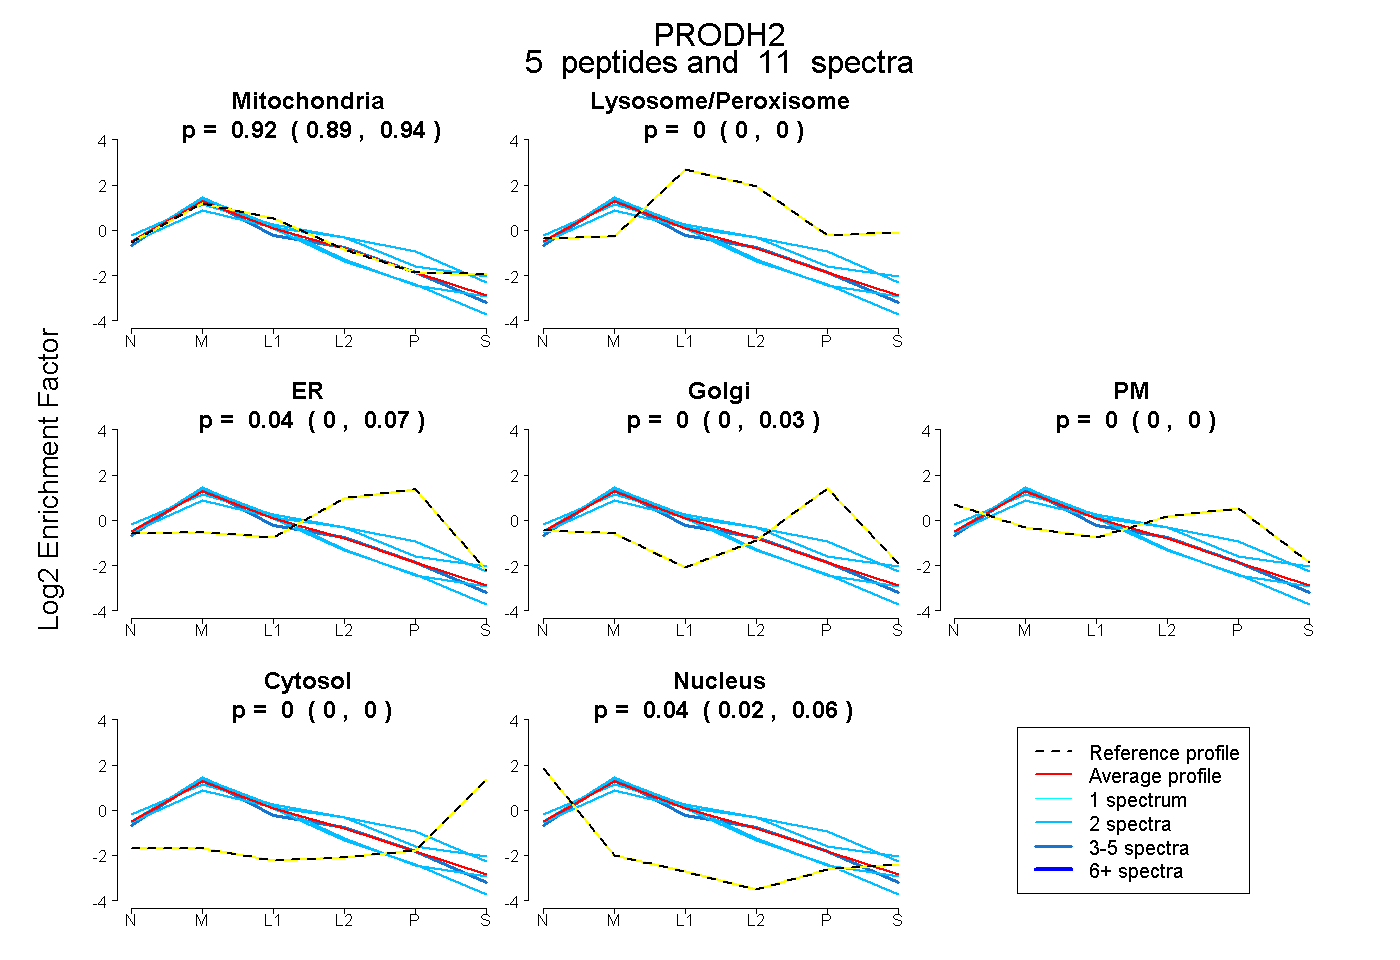
0.889 | 0.943
0.000 | 0.000
0.000 | 0.065
0.000 | 0.030
0.000 | 0.000
0.000 | 0.000
0.025 | 0.055
10peptides
spectra
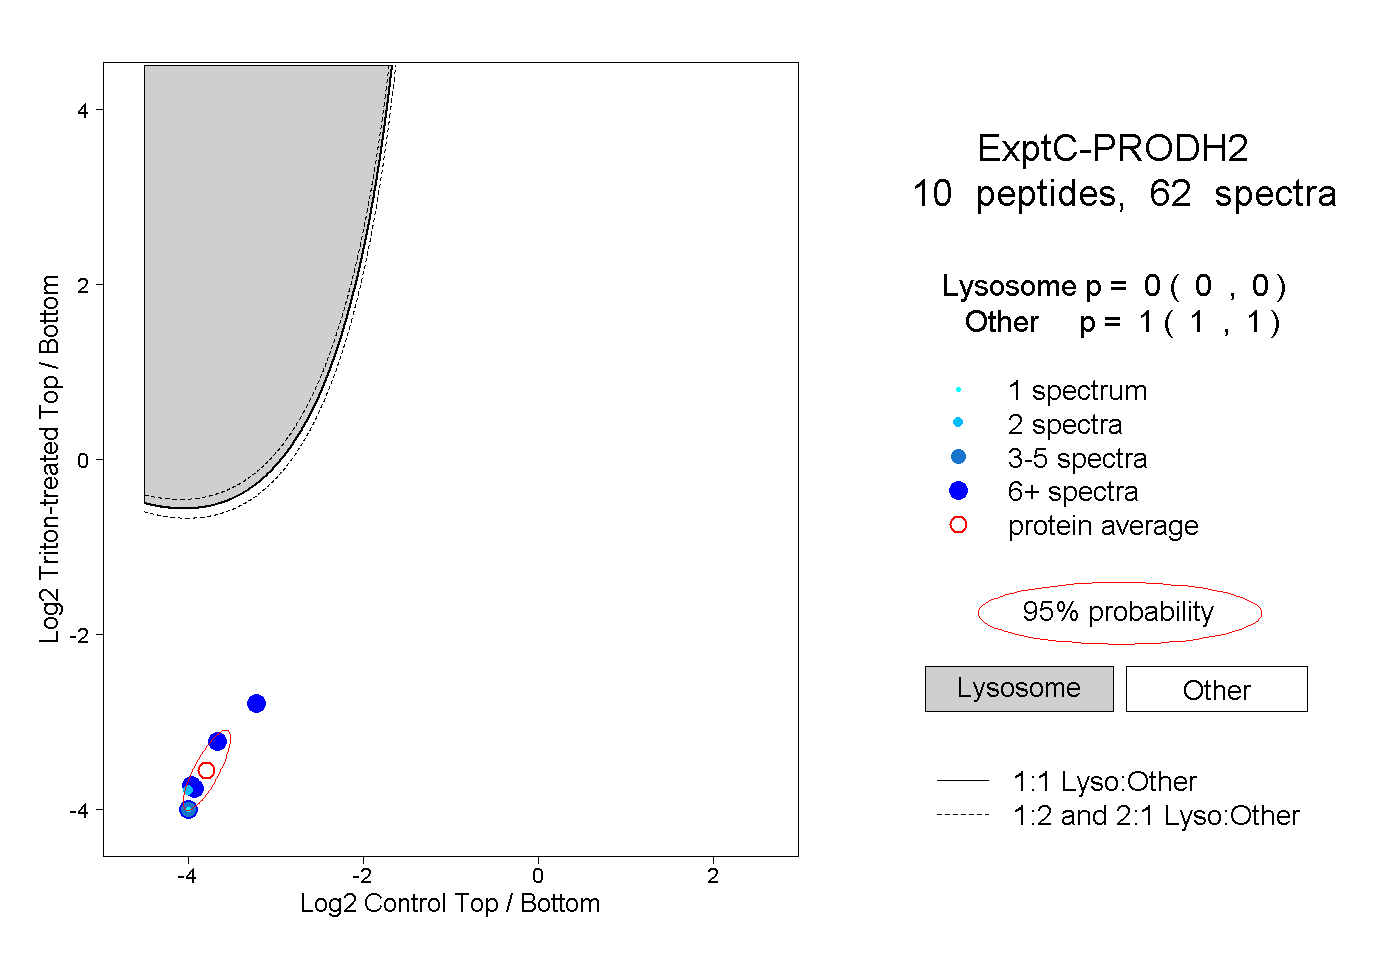
0.000 | 0.000
1.000 | 1.000
2peptides
spectra
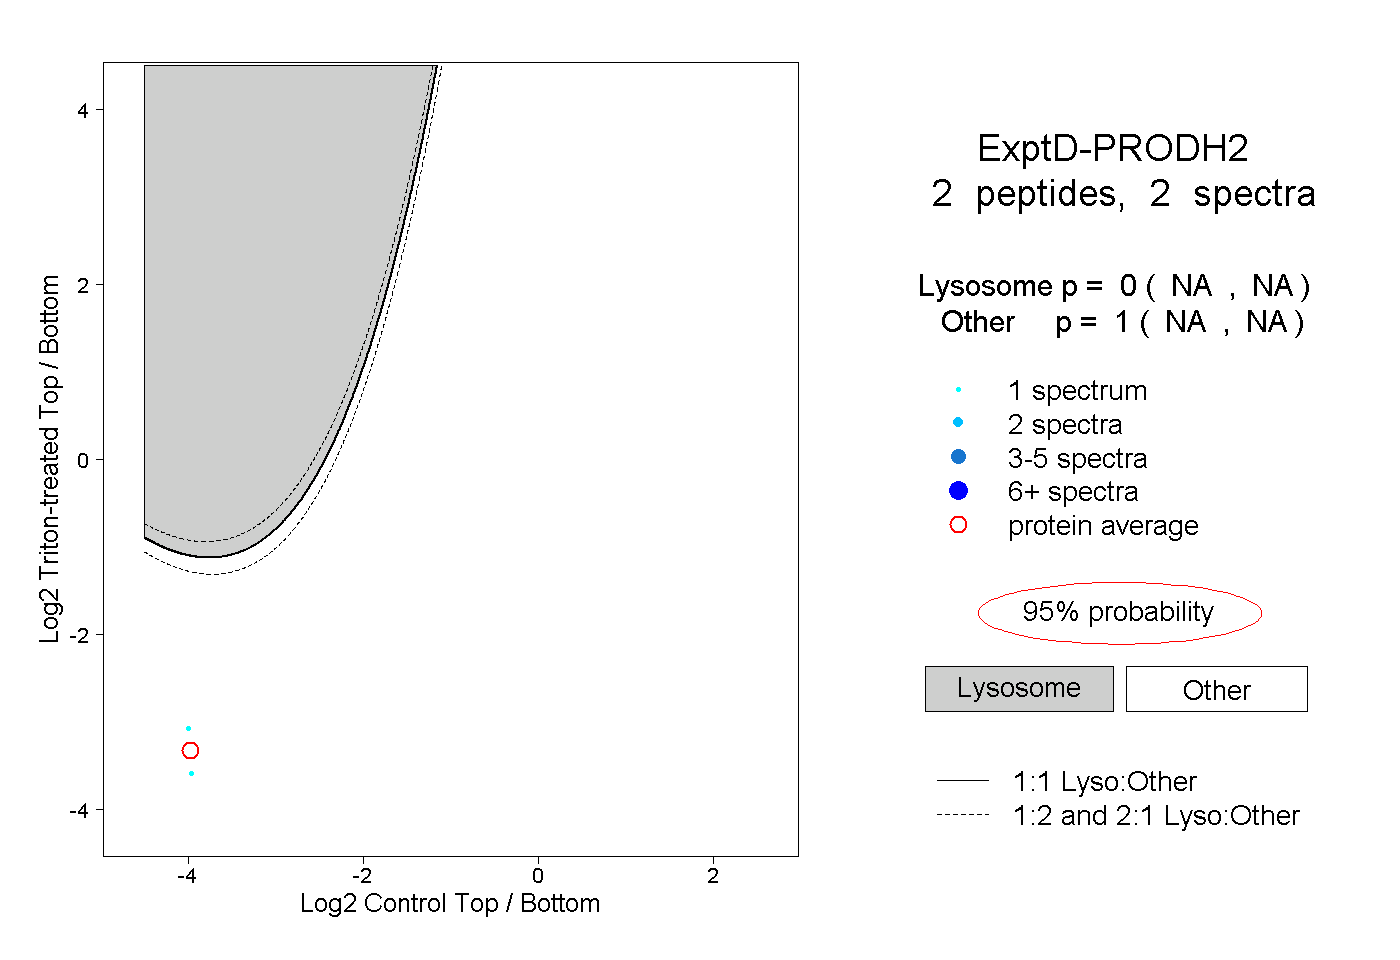
NA | NA
NA | NA