 8
8peptides
spectra
0.778 | 0.803
0.000 | 0.000
0.000 | 0.000
0.045 | 0.117
0.043 | 0.090
0.019 | 0.088
0.000 | 0.000
0.000 | 0.000
| Plot | Mito | Lyso | Perox | ER | Golgi | PM | Cytosol | Nucleus | |||||
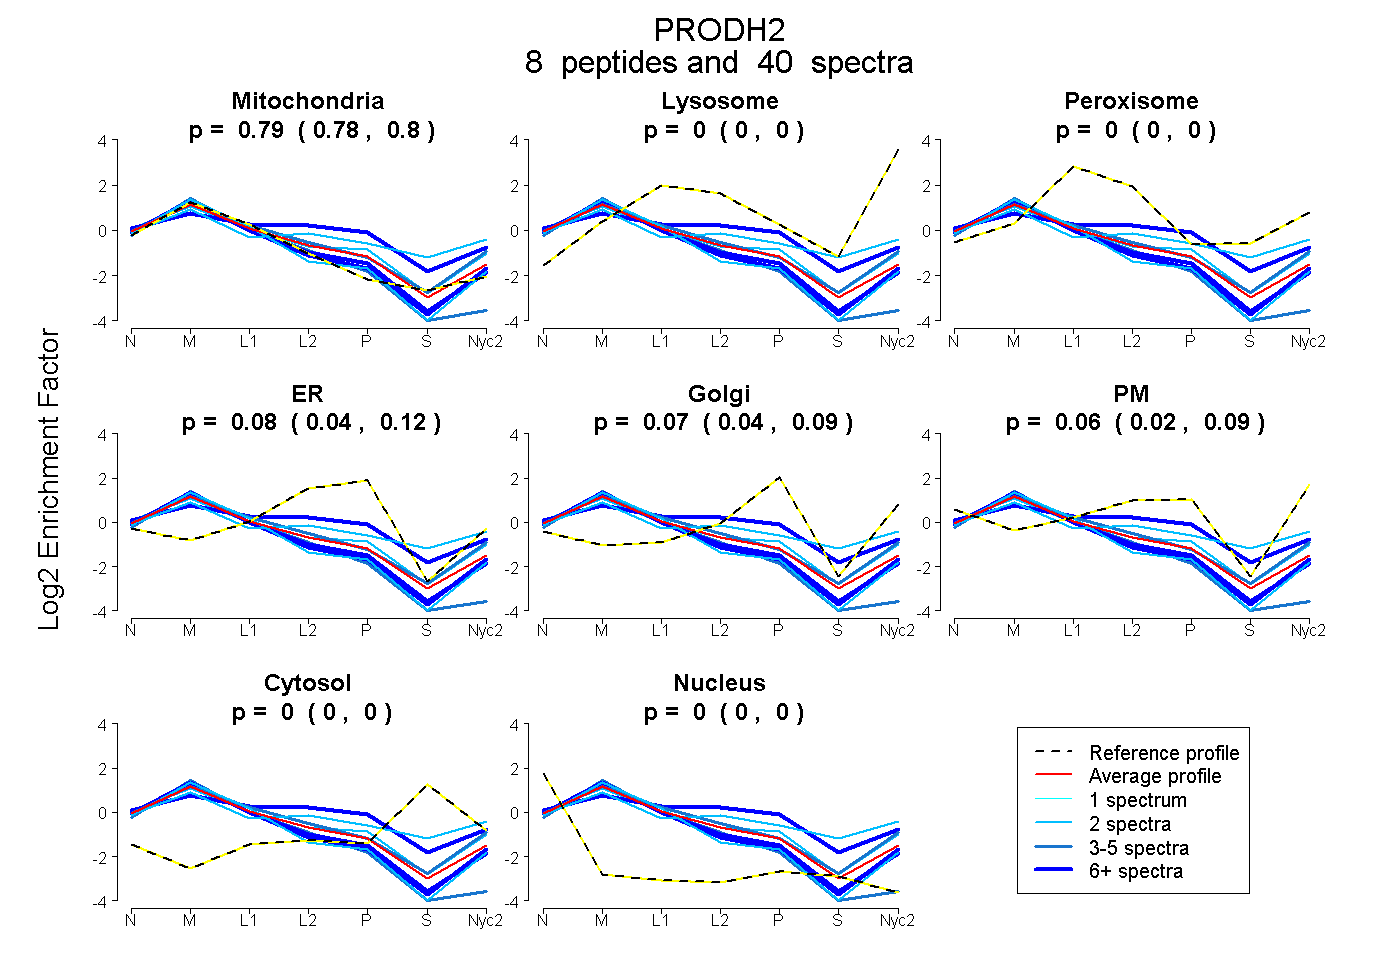
| Expt A |
8 peptides |
40 spectra |
|
0.792 0.778 | 0.803 |
0.000 0.000 | 0.000 |
0.000 0.000 | 0.000 |
0.084 0.045 | 0.117 |
0.067 0.043 | 0.090 |
0.057 0.019 | 0.088 |
0.000 0.000 | 0.000 |
0.000 0.000 | 0.000 |
| 11 spectra, CHLMVASHNEESIR | 0.447 | 0.000 | 0.147 | 0.199 | 0.102 | 0.098 | 0.007 | 0.000 | ||
| 2 spectra, AAHEAGLAFGVK | 0.698 | 0.000 | 0.000 | 0.000 | 0.125 | 0.177 | 0.000 | 0.000 | ||
| 2 spectra, VSNHGPR | 0.455 | 0.060 | 0.031 | 0.000 | 0.015 | 0.279 | 0.160 | 0.000 | ||
| 2 spectra, SVTQLHGK | 0.935 | 0.000 | 0.000 | 0.000 | 0.058 | 0.000 | 0.000 | 0.007 | ||
| 6 spectra, EQALLSQELWR | 0.906 | 0.000 | 0.000 | 0.000 | 0.076 | 0.009 | 0.000 | 0.008 | ||
| 10 spectra, SVLQGAR | 0.878 | 0.000 | 0.000 | 0.063 | 0.045 | 0.000 | 0.000 | 0.013 | ||
| 4 spectra, SVLQQR | 0.728 | 0.007 | 0.000 | 0.000 | 0.000 | 0.264 | 0.000 | 0.000 | ||
| 3 spectra, CLELMLR | 0.935 | 0.000 | 0.000 | 0.000 | 0.000 | 0.000 | 0.000 | 0.065 |
| Plot | Mito | Lyso or Perox | ER | Golgi | PM | Cytosol | Nucleus | ||||||
| Expt B |
5 peptides |
11 spectra |
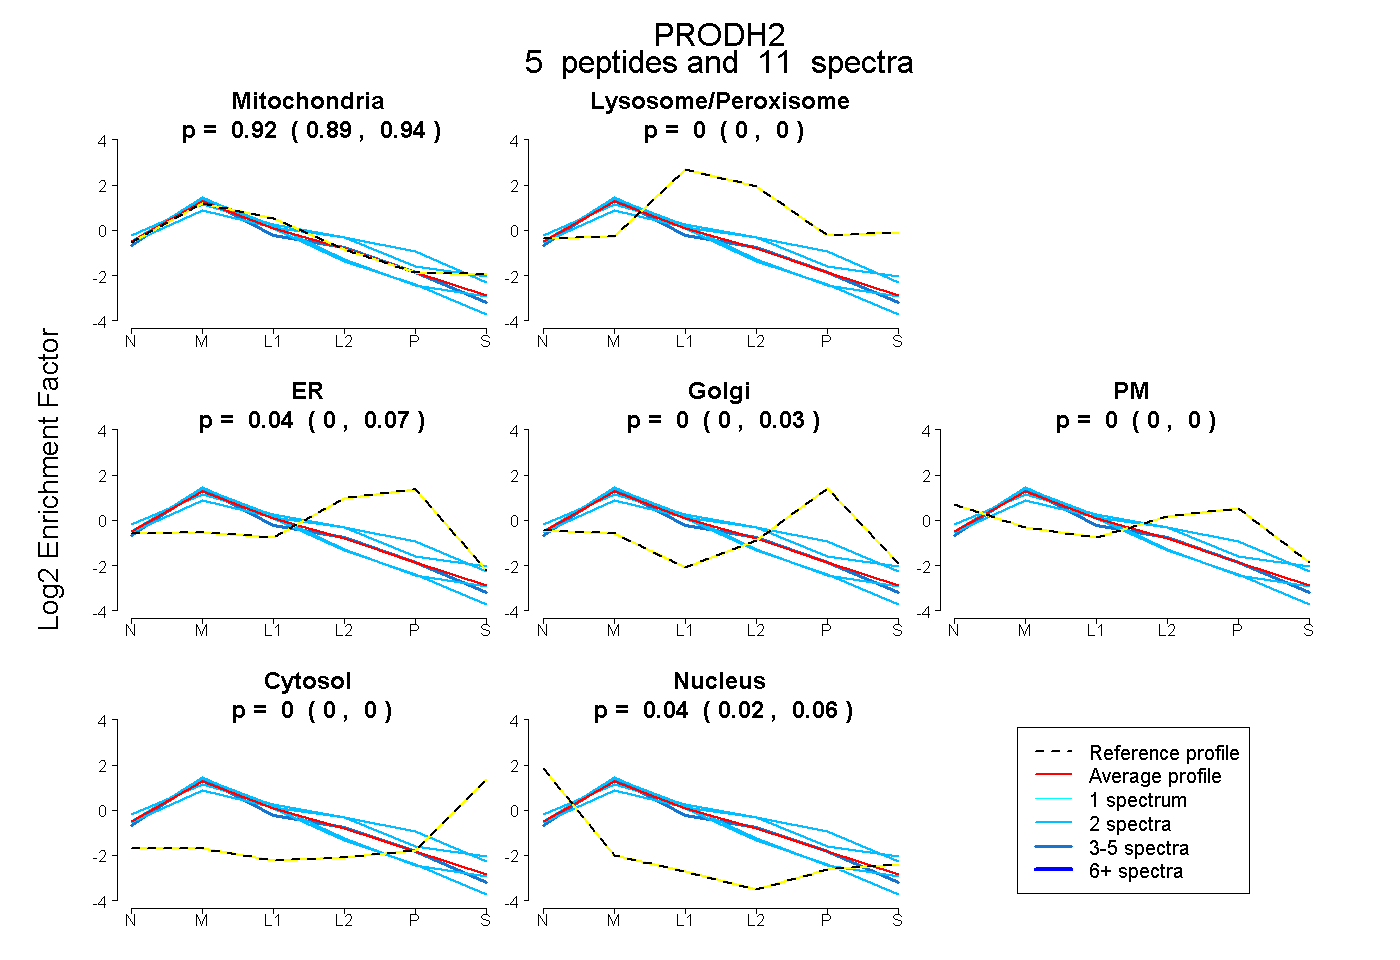 |
0.918 0.889 | 0.943 |
0.000 0.000 | 0.000 |
0.039 0.000 | 0.065 |
0.000 0.000 | 0.030 |
0.000 0.000 | 0.000 |
0.000 0.000 | 0.000 |
0.043 0.025 | 0.055 |
|||
| Plot | Lyso | Other | |||||||||||
| Expt C |
10 peptides |
62 spectra |
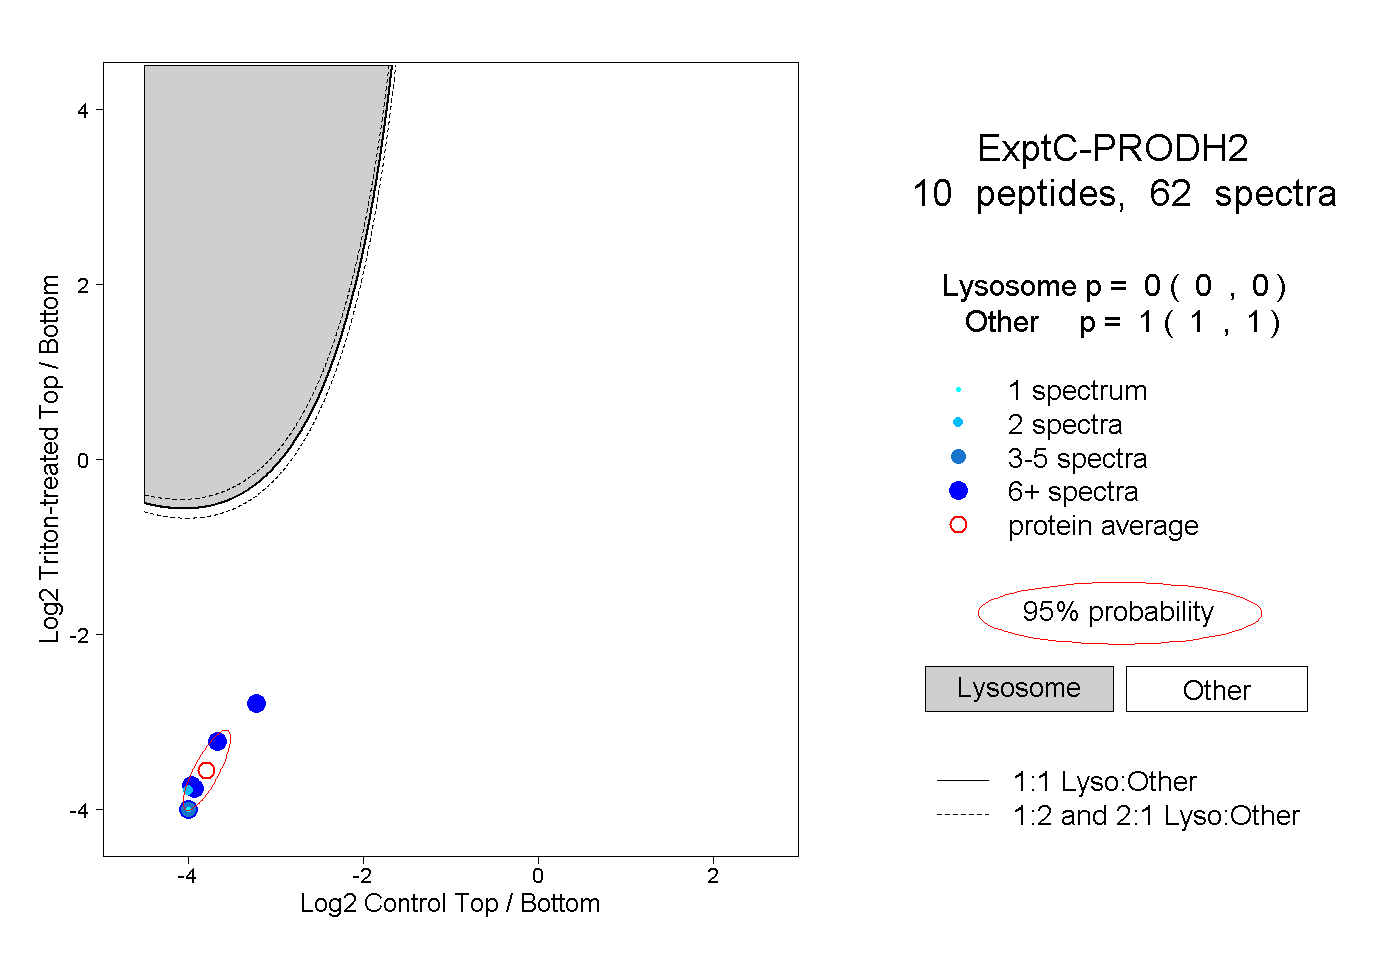 |
0.000 0.000 | 0.000 |
1.000 1.000 | 1.000 |
||||||||
| Plot | Lyso | Other | |||||||||||
| Expt D |
2 peptides |
2 spectra |
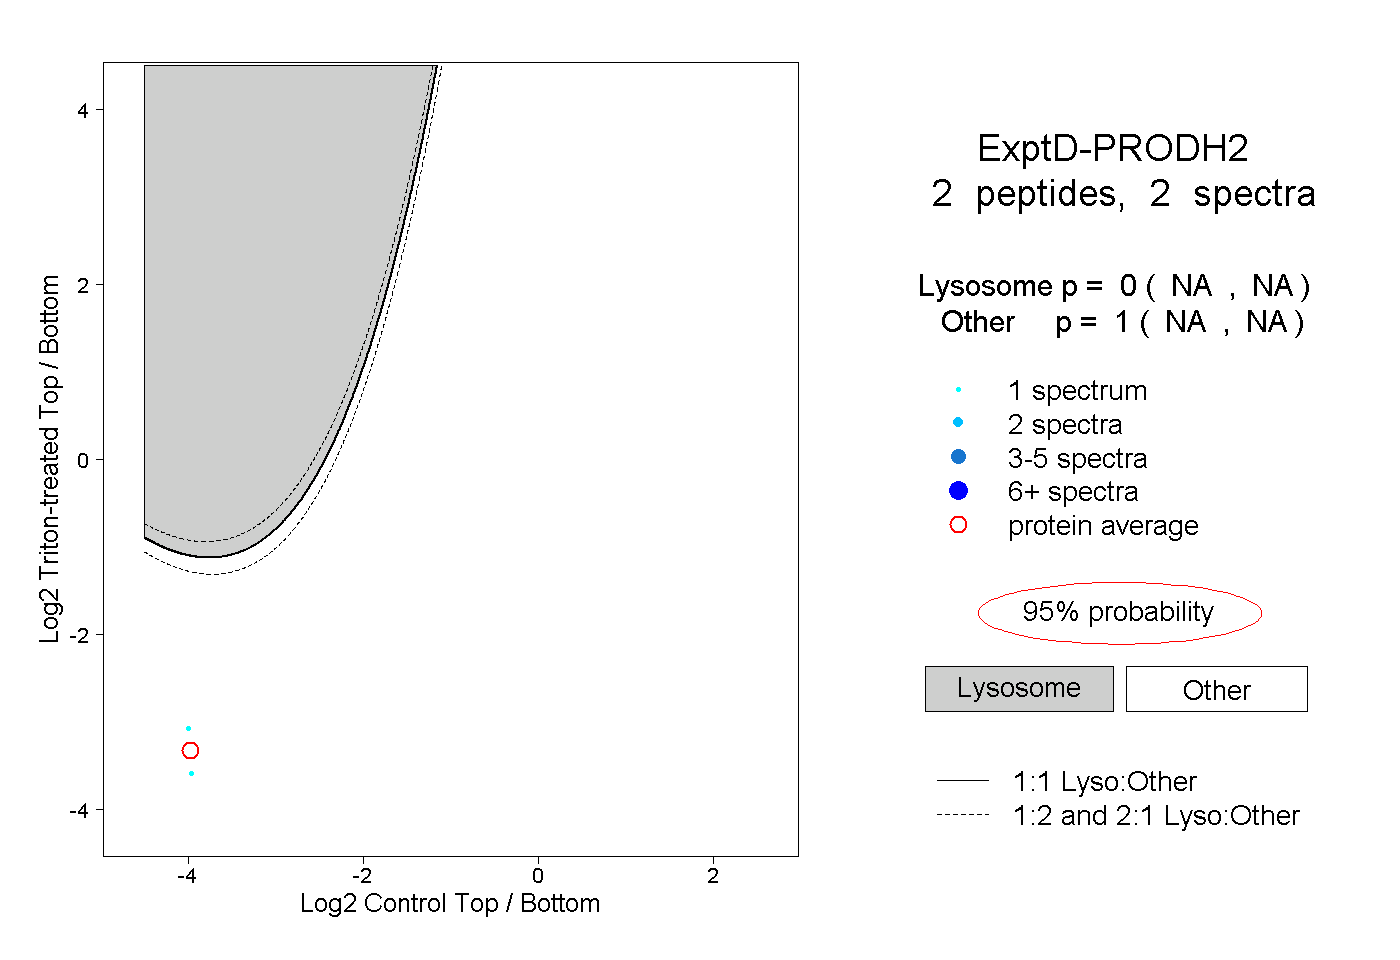 |
0.000 NA | NA |
1.000 NA | NA |