 3
3peptides
spectra
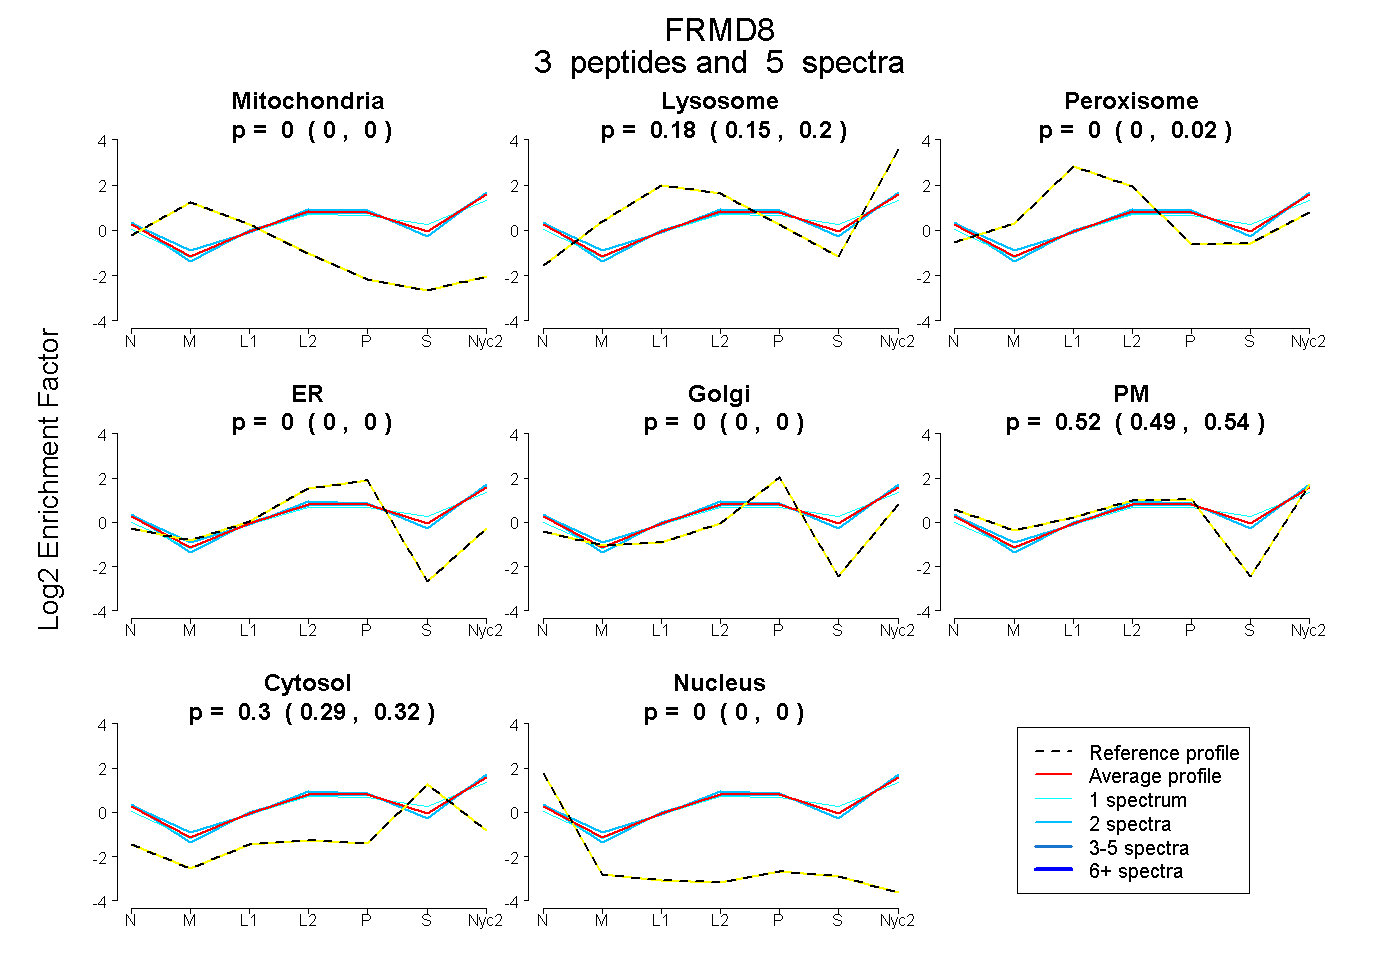
0.000 | 0.000
0.148 | 0.200
0.000 | 0.016
0.000 | 0.000
0.000 | 0.000
0.486 | 0.544
0.287 | 0.316
0.000 | 0.000
2peptides
spectra
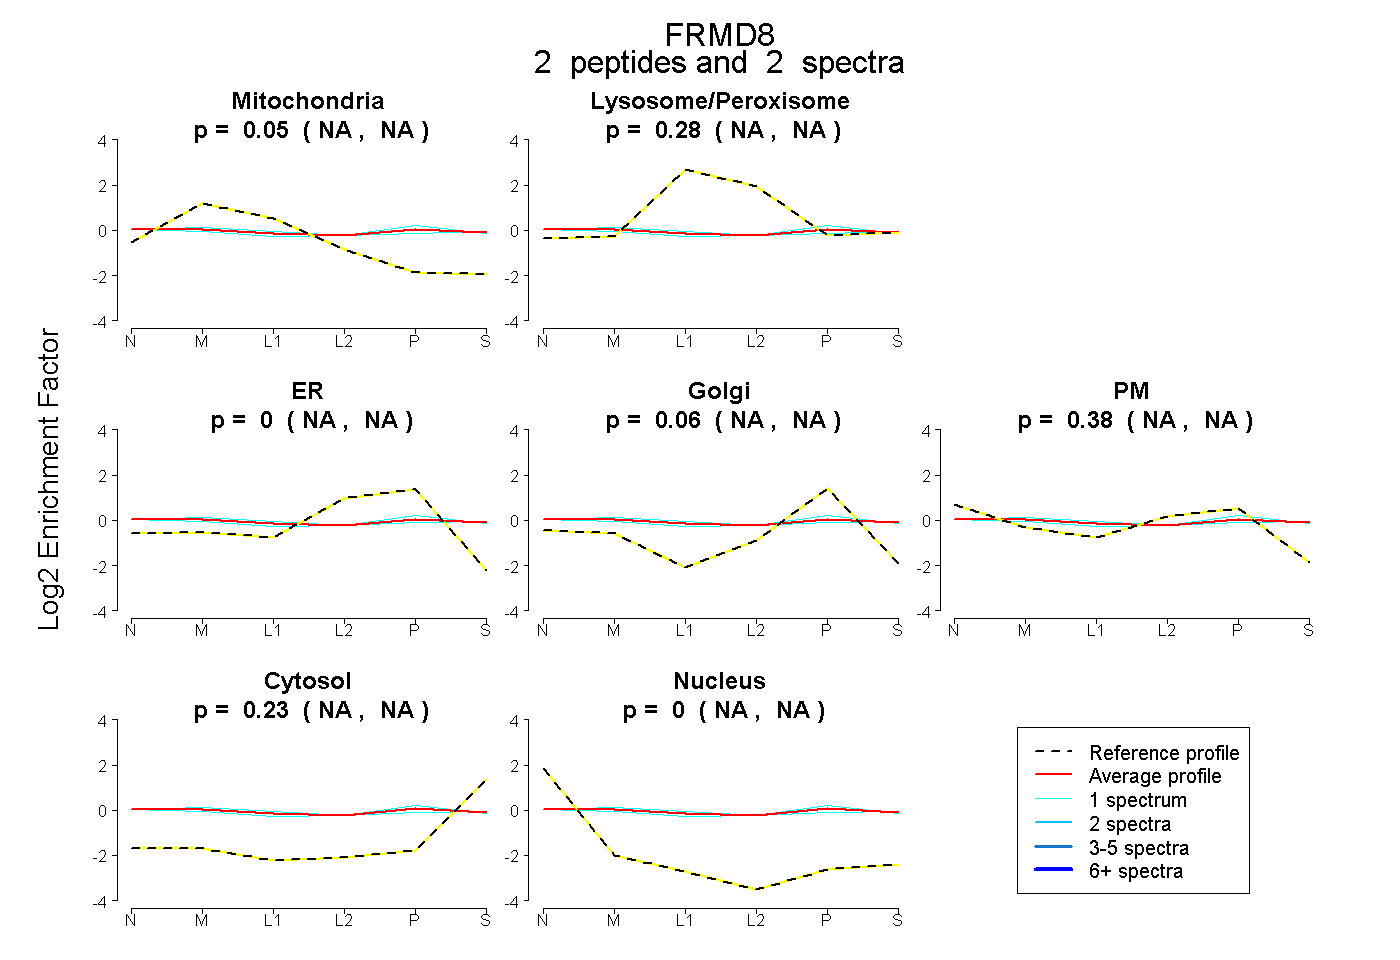
NA | NA
NA | NA
NA | NA
NA | NA
NA | NA
NA | NA
NA | NA
3peptides
spectra
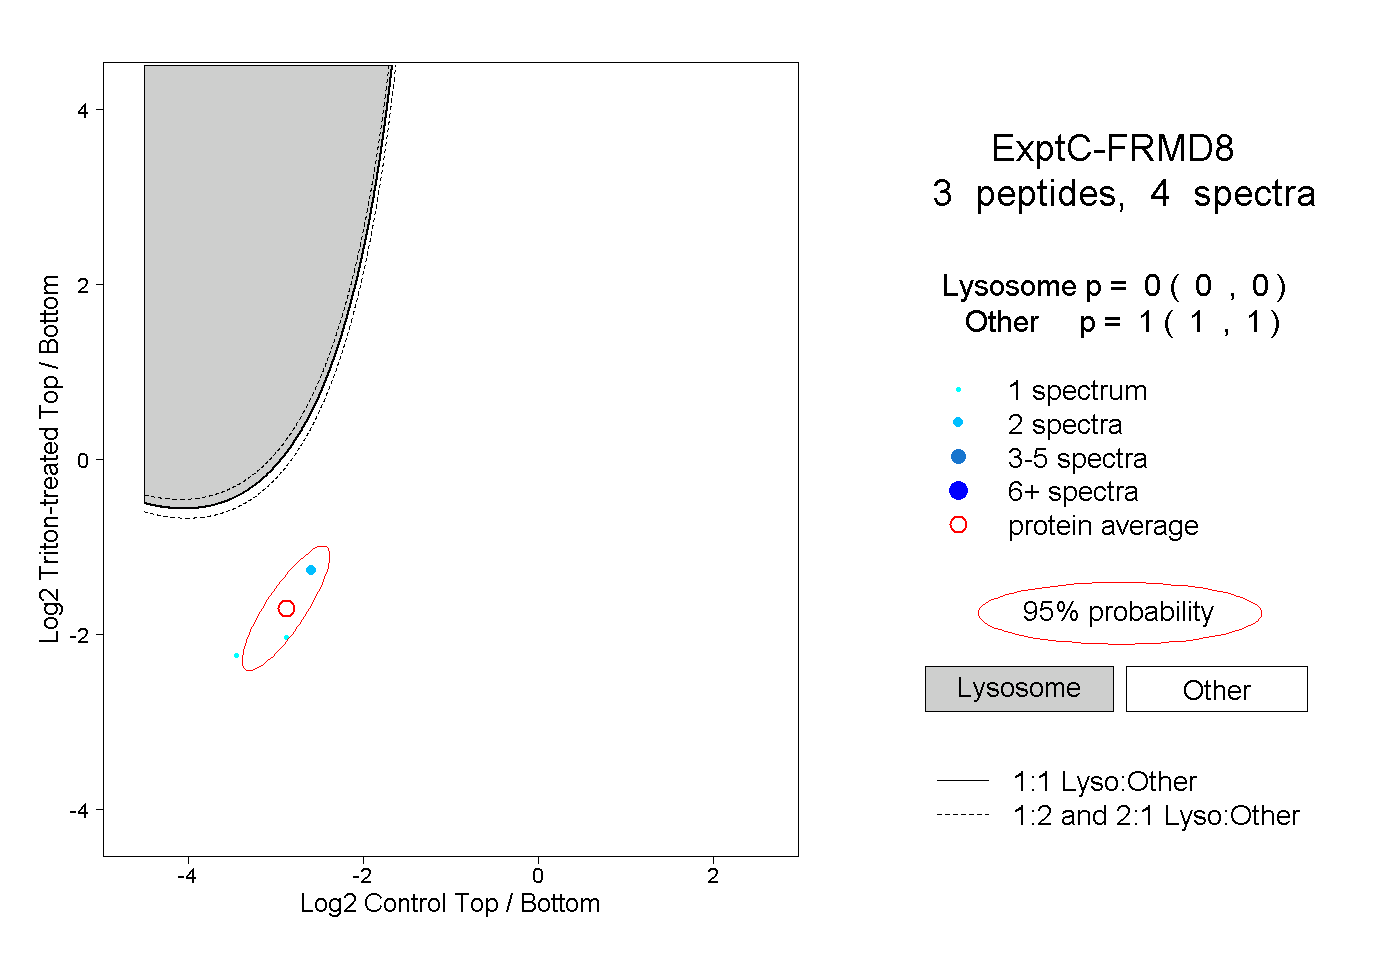
0.000 | 0.000
1.000 | 1.000
1peptide
spectrum
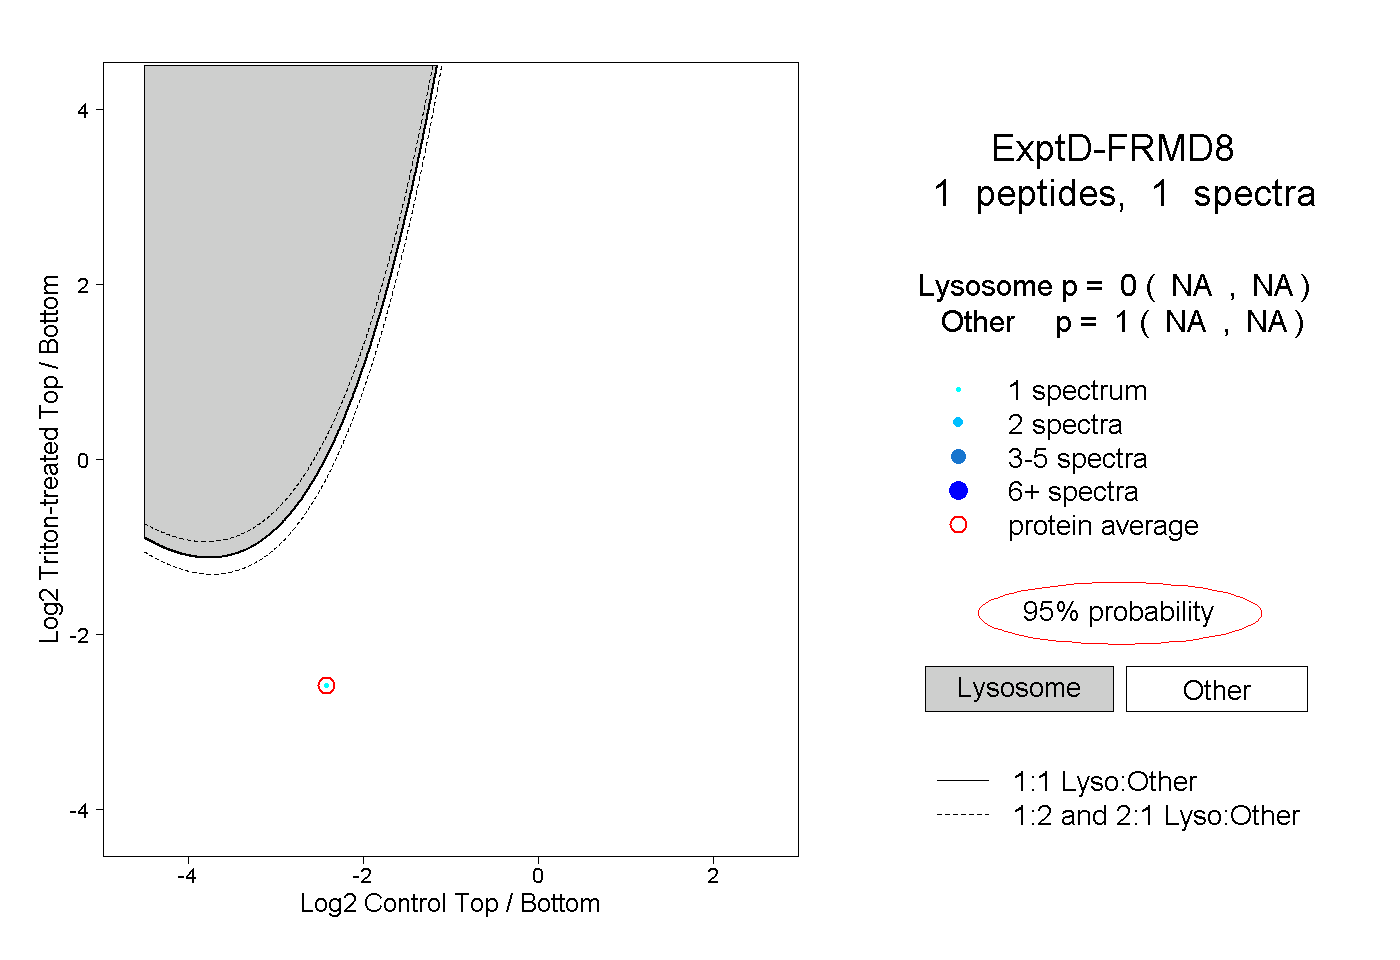
NA | NA
NA | NA