 3
3peptides
spectra
0.000 | 0.000
0.148 | 0.200
0.000 | 0.016
0.000 | 0.000
0.000 | 0.000
0.486 | 0.544
0.287 | 0.316
0.000 | 0.000
| Plot | Mito | Lyso | Perox | ER | Golgi | PM | Cytosol | Nucleus | |||||
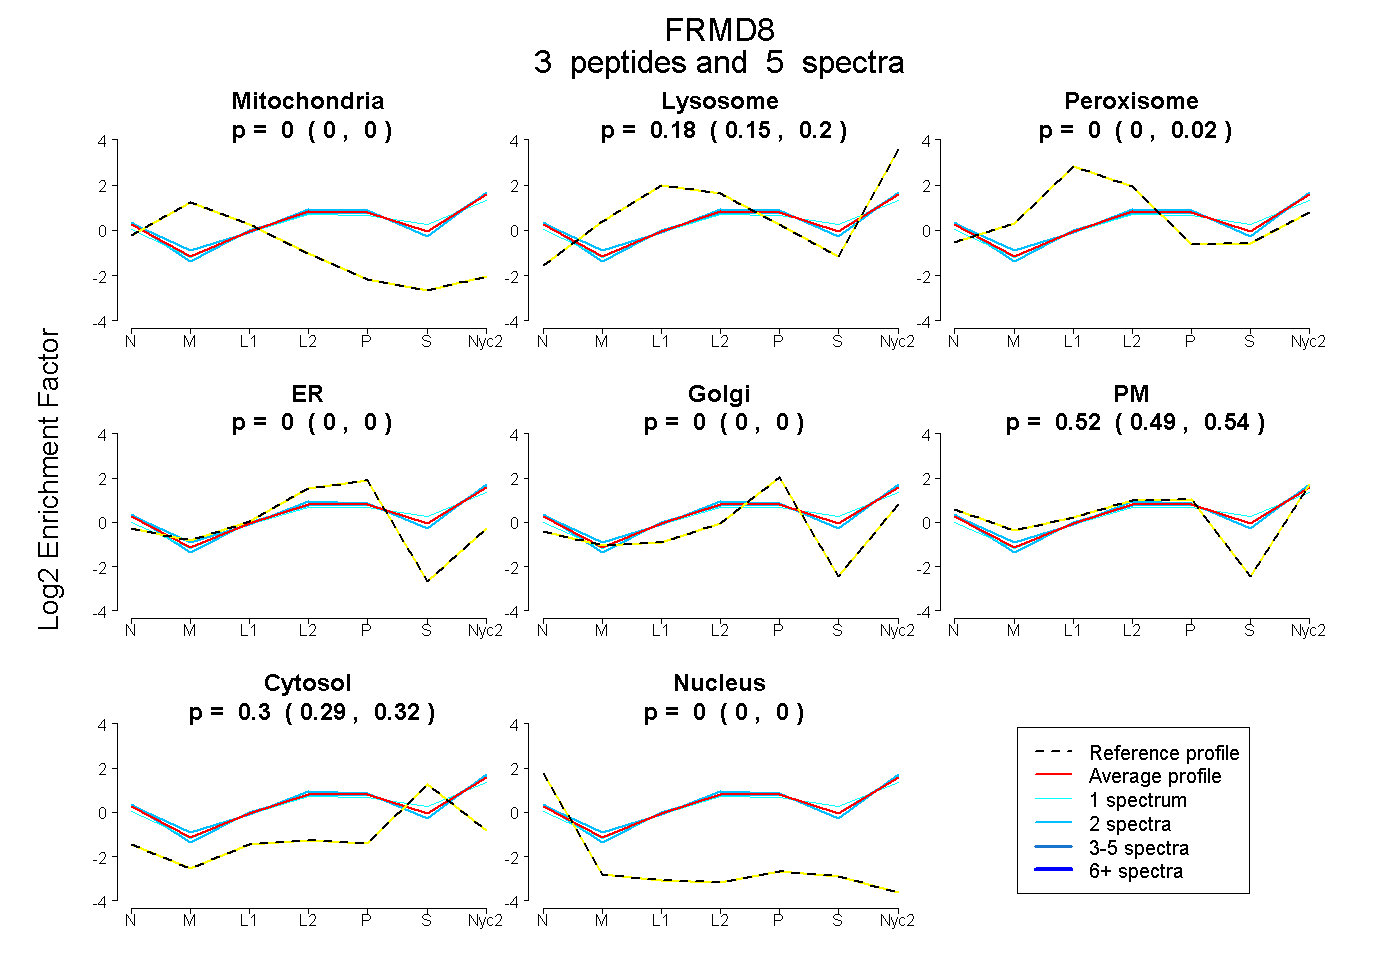
| Expt A |
3 peptides |
5 spectra |
|
0.000 0.000 | 0.000 |
0.179 0.148 | 0.200 |
0.000 0.000 | 0.016 |
0.000 0.000 | 0.000 |
0.000 0.000 | 0.000 |
0.518 0.486 | 0.544 |
0.303 0.287 | 0.316 |
0.000 0.000 | 0.000 |
| 2 spectra, HVLLGLR | 0.000 | 0.174 | 0.000 | 0.000 | 0.000 | 0.574 | 0.253 | 0.000 | ||
| 1 spectrum, GHGLFAAFR | 0.000 | 0.191 | 0.020 | 0.000 | 0.000 | 0.418 | 0.371 | 0.000 | ||
| 2 spectra, ELQVHDEEVLR | 0.000 | 0.157 | 0.000 | 0.000 | 0.000 | 0.536 | 0.307 | 0.000 |
| Plot | Mito | Lyso or Perox | ER | Golgi | PM | Cytosol | Nucleus | ||||||
| Expt B |
2 peptides |
2 spectra |
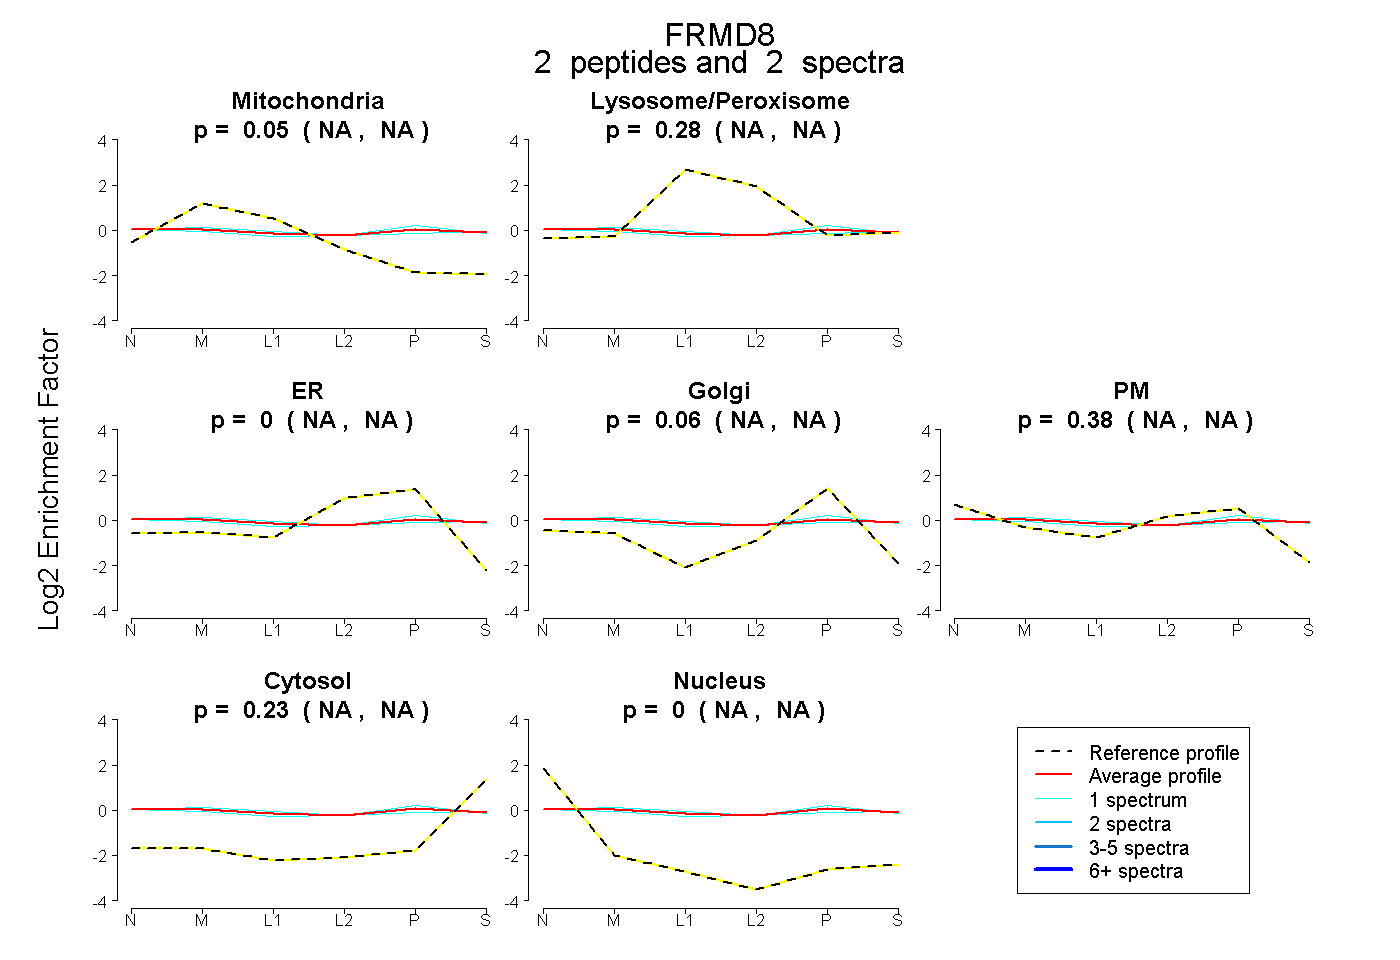 |
0.047 NA | NA |
0.279 NA | NA |
0.000 NA | NA |
0.063 NA | NA |
0.379 NA | NA |
0.231 NA | NA |
0.000 NA | NA |
|||
| Plot | Lyso | Other | |||||||||||
| Expt C |
3 peptides |
4 spectra |
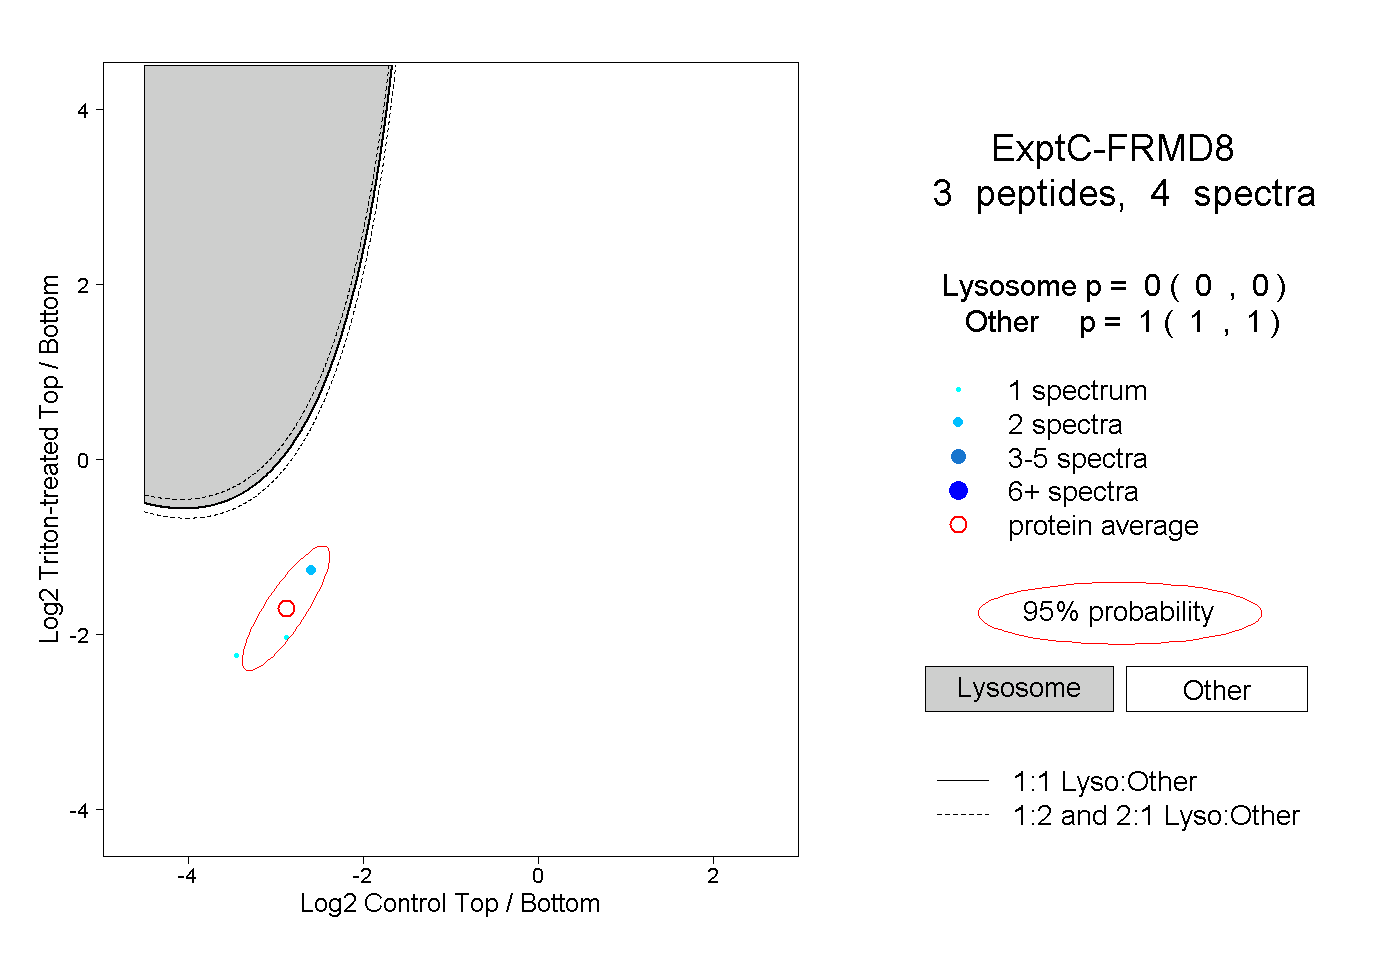 |
0.000 0.000 | 0.000 |
1.000 1.000 | 1.000 |
||||||||
| Plot | Lyso | Other | |||||||||||
| Expt D |
1 peptide |
1 spectrum |
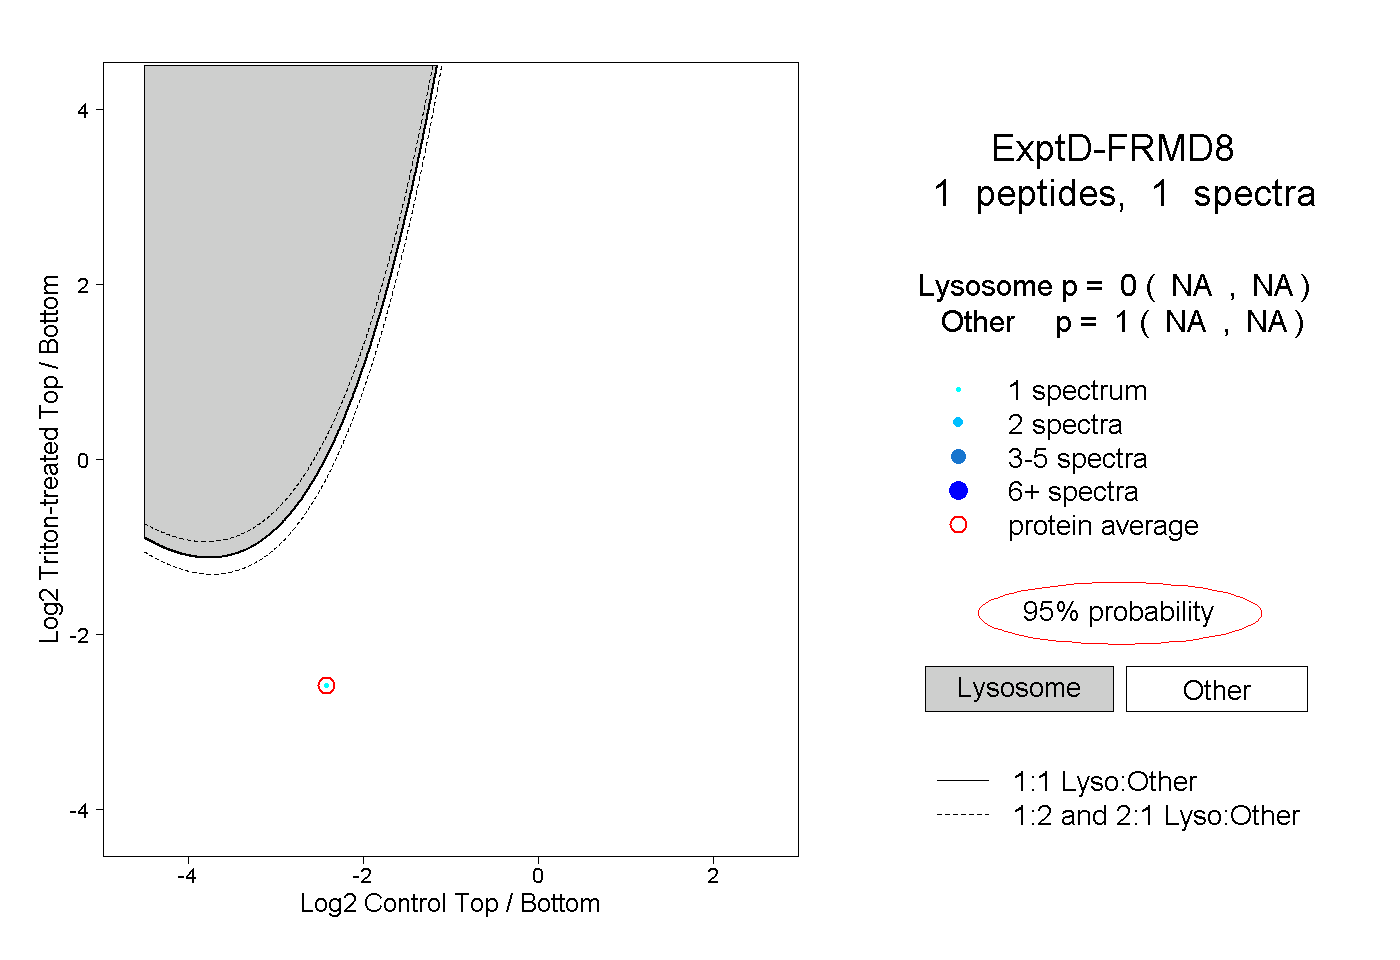 |
0.000 NA | NA |
1.000 NA | NA |