 8
8peptides
spectra
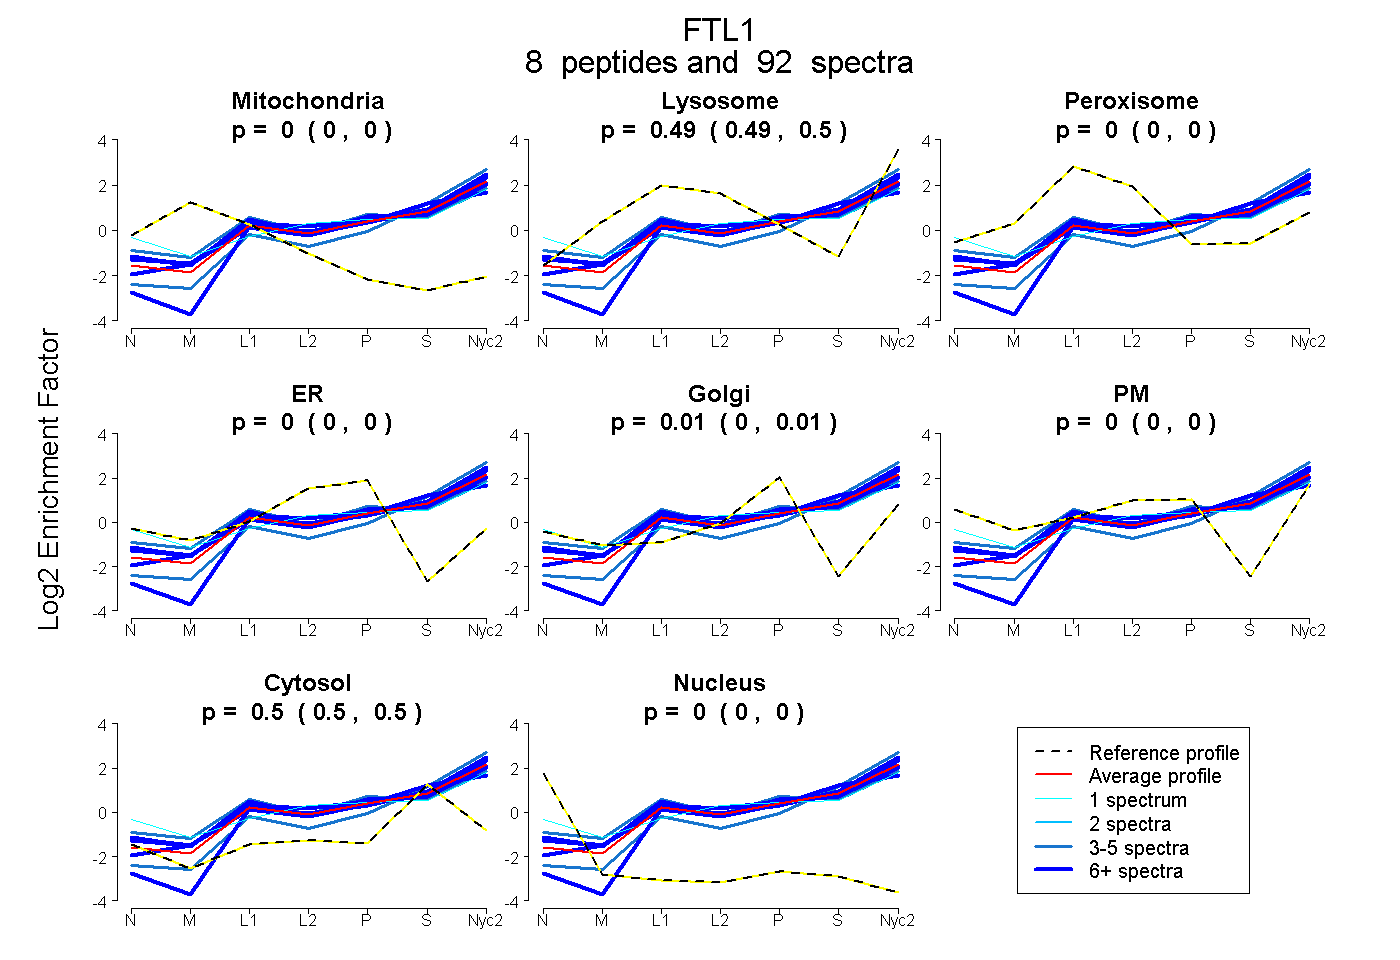
0.000 | 0.000
0.489 | 0.498
0.000 | 0.000
0.000 | 0.000
0.001 | 0.011
0.000 | 0.000
0.496 | 0.504
0.000 | 0.000
5peptides
spectra
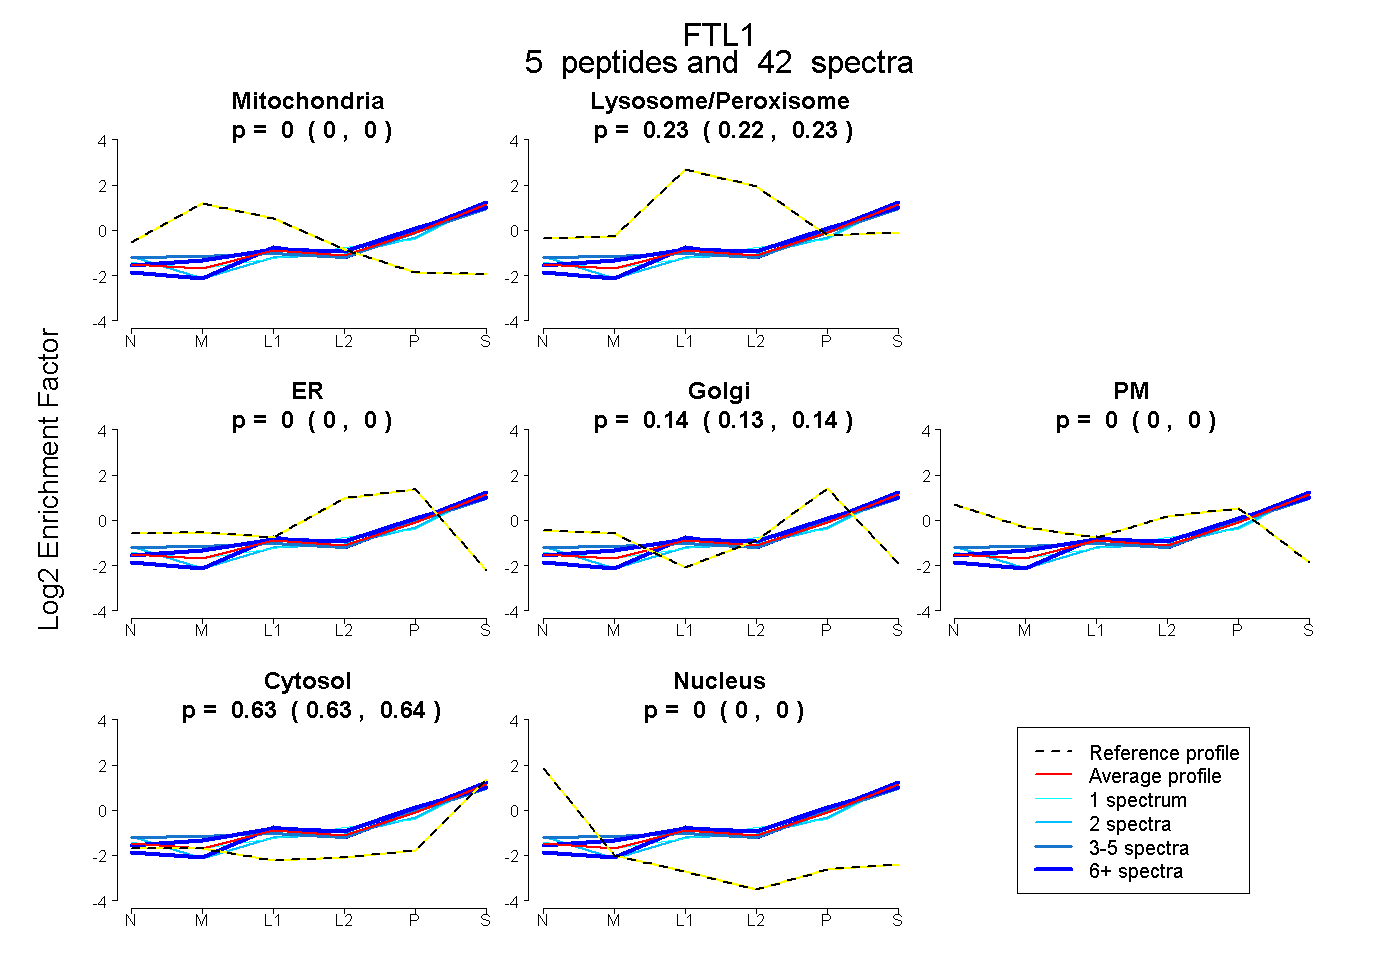
0.000 | 0.000
0.223 | 0.231
0.000 | 0.000
0.132 | 0.144
0.000 | 0.000
0.629 | 0.639
0.000 | 0.000
6peptides
spectra
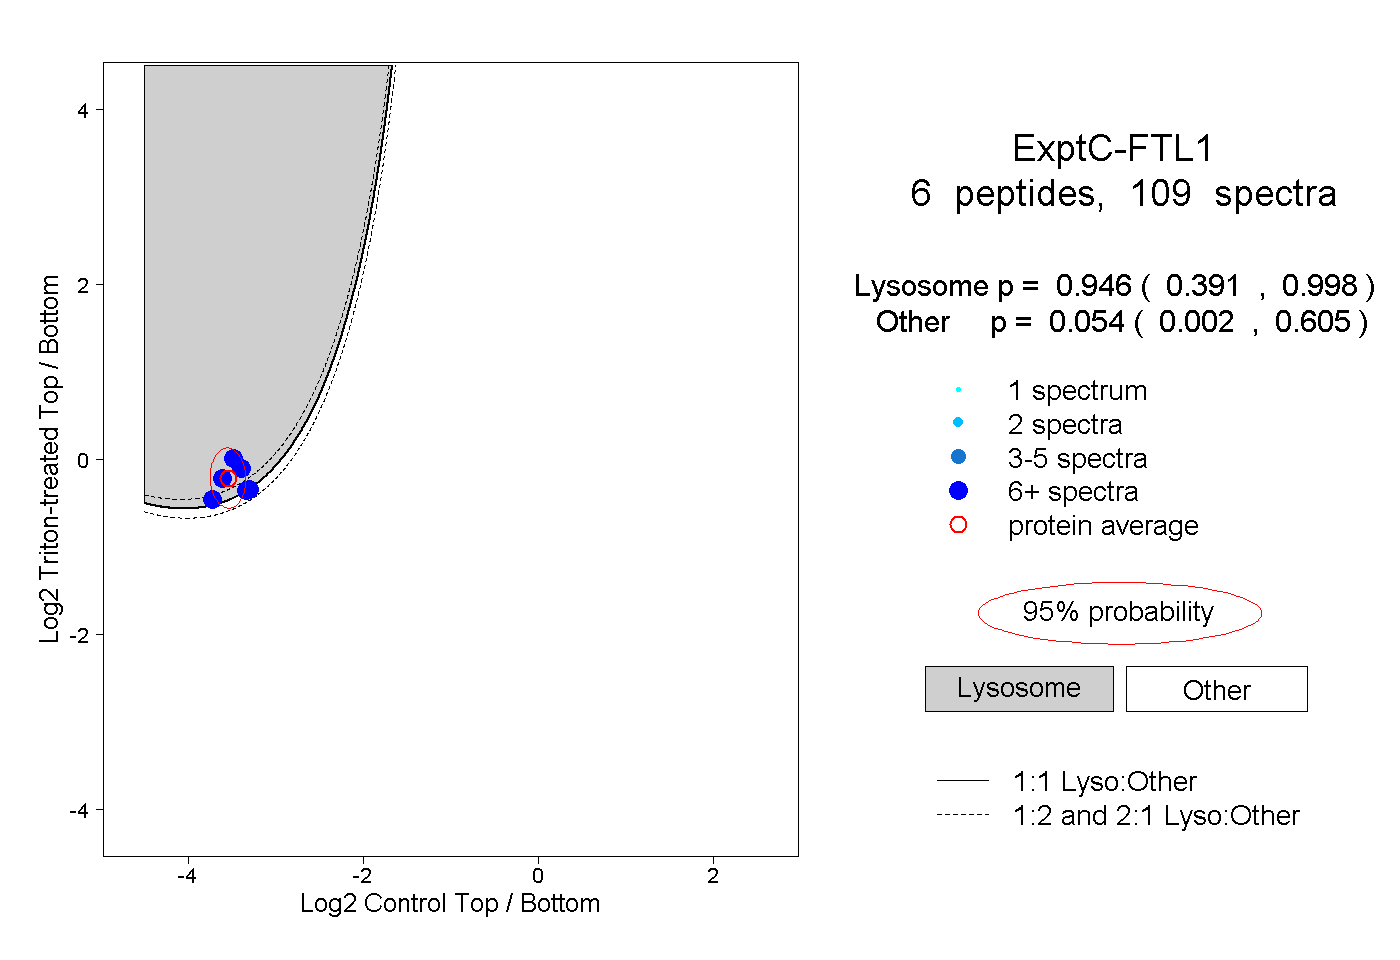
0.391 | 0.998
0.002 | 0.605
5peptides
spectra
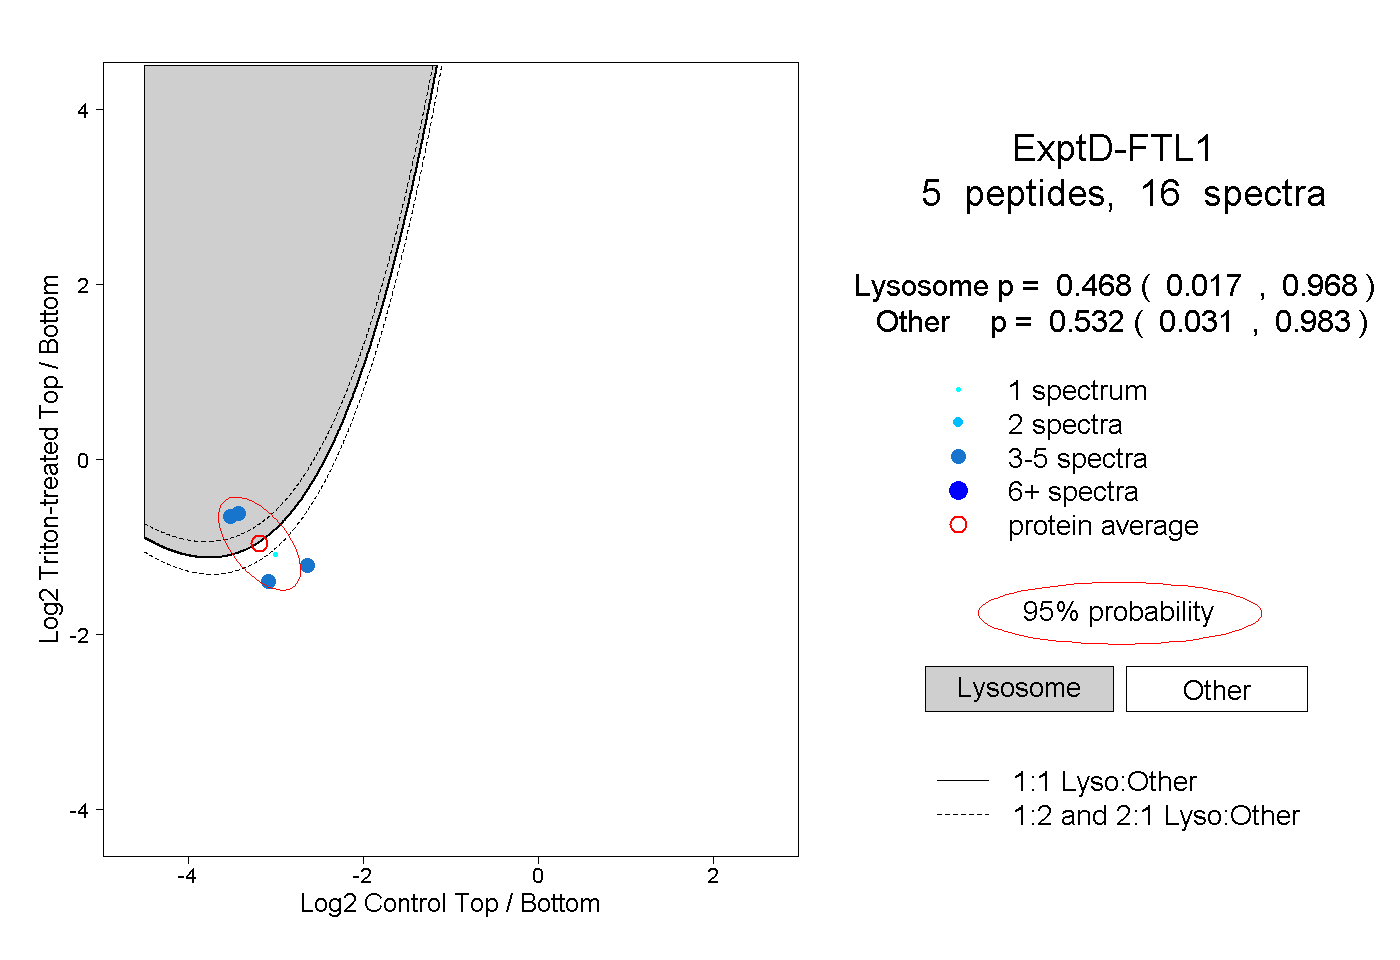
0.017 | 0.968
0.031 | 0.983