 8
8peptides
spectra
0.000 | 0.000
0.489 | 0.498
0.000 | 0.000
0.000 | 0.000
0.001 | 0.011
0.000 | 0.000
0.496 | 0.504
0.000 | 0.000
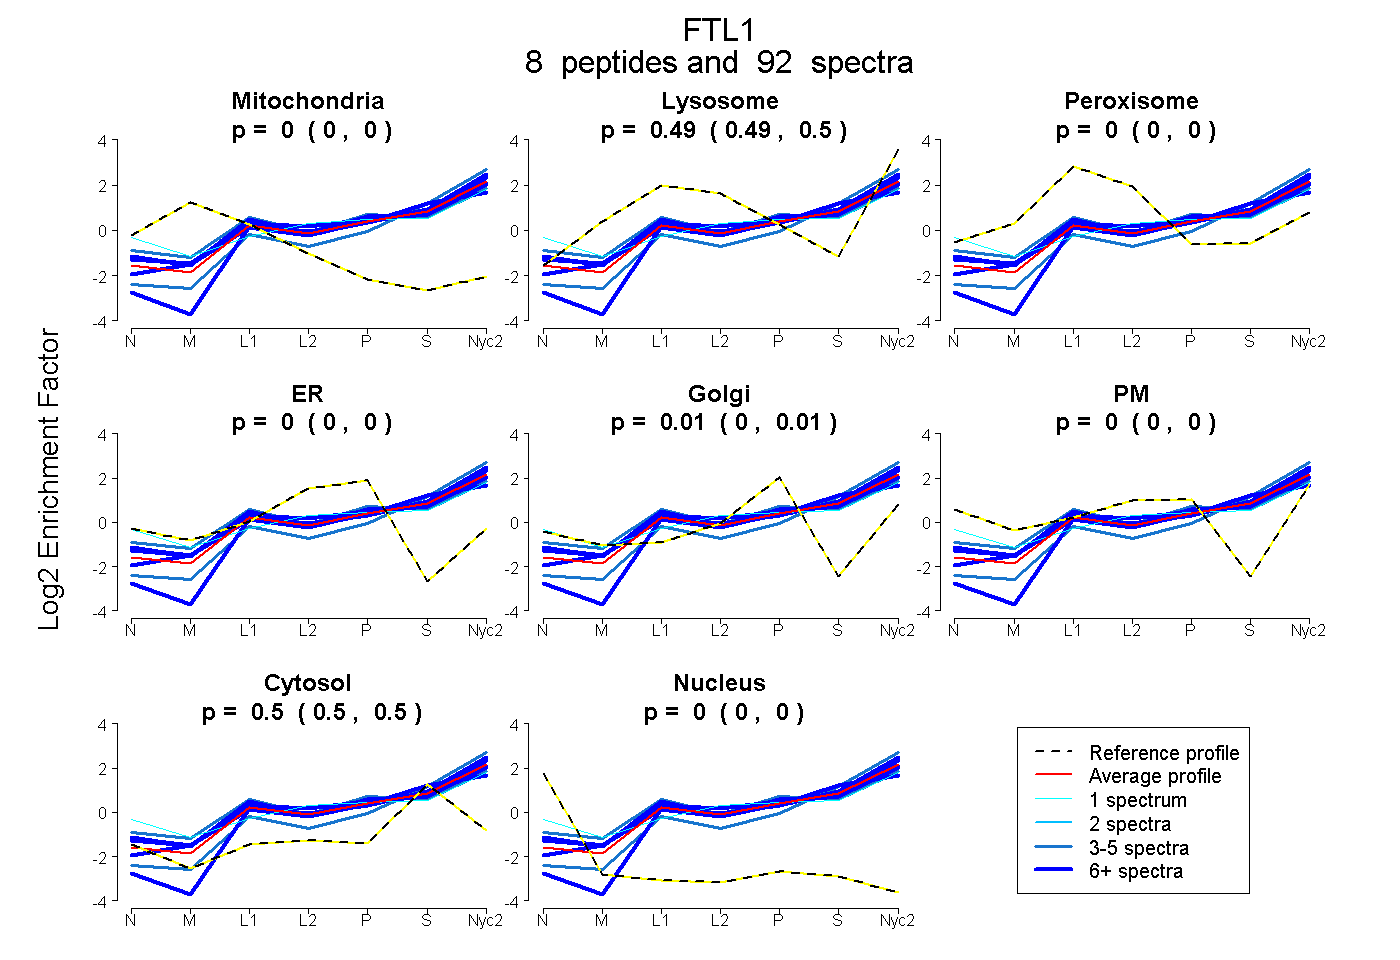
| Plot | Mito | Lyso | Perox | ER | Golgi | PM | Cytosol | Nucleus | |||||
| Expt A |
8 peptides |
92 spectra |
|
0.000 0.000 | 0.000 |
0.493 0.489 | 0.498 |
0.000 0.000 | 0.000 |
0.000 0.000 | 0.000 |
0.007 0.001 | 0.011 |
0.000 0.000 | 0.000 |
0.500 0.496 | 0.504 |
0.000 0.000 | 0.000 |
| 24 spectra, LVNLHLR | 0.000 | 0.534 | 0.000 | 0.000 | 0.000 | 0.000 | 0.466 | 0.000 | ||
| 3 spectra, ALFQDVQKPSQDEWGK | 0.000 | 0.481 | 0.000 | 0.000 | 0.122 | 0.000 | 0.397 | 0.000 | ||
| 1 spectrum, TSQIR | 0.000 | 0.311 | 0.000 | 0.000 | 0.000 | 0.268 | 0.421 | 0.000 | ||
| 17 spectra, QNYSTEVEAAVNR | 0.000 | 0.468 | 0.000 | 0.000 | 0.054 | 0.000 | 0.478 | 0.000 | ||
| 13 spectra, MGNHLTNLR | 0.000 | 0.493 | 0.000 | 0.000 | 0.069 | 0.000 | 0.438 | 0.000 | ||
| 4 spectra, DDVALEGVGHFFR | 0.000 | 0.419 | 0.000 | 0.000 | 0.000 | 0.000 | 0.581 | 0.000 | ||
| 6 spectra, IDPHLCDFLESHFLDK | 0.000 | 0.341 | 0.000 | 0.000 | 0.000 | 0.000 | 0.659 | 0.000 | ||
| 24 spectra, TLEAMEAALALEK | 0.000 | 0.540 | 0.000 | 0.000 | 0.033 | 0.000 | 0.427 | 0.000 |
| Plot | Mito | Lyso or Perox | ER | Golgi | PM | Cytosol | Nucleus | ||||||
| Expt B |
5 peptides |
42 spectra |
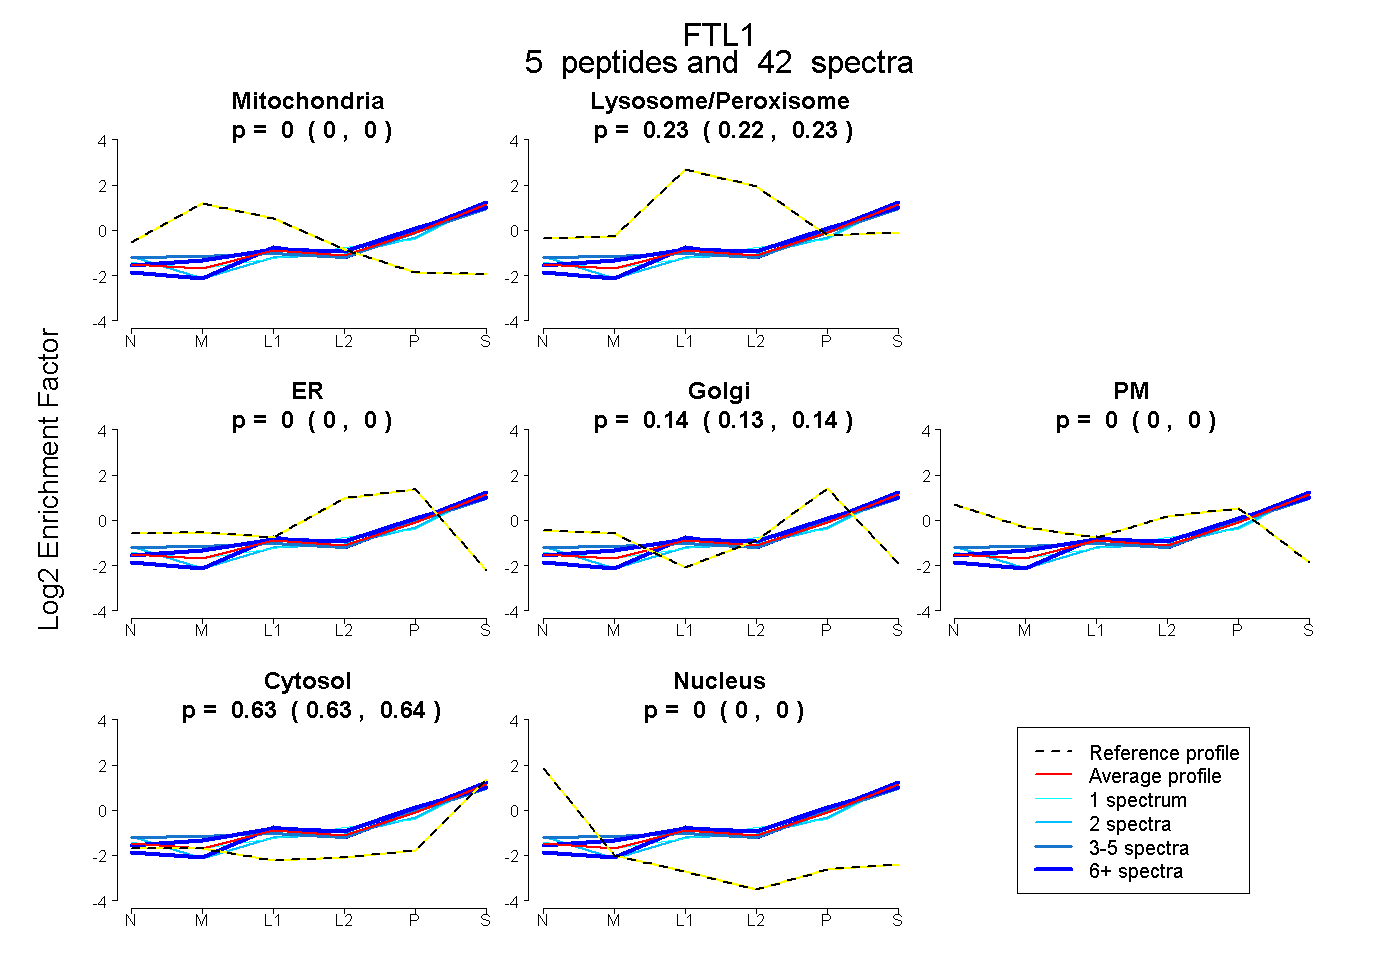 |
0.000 0.000 | 0.000 |
0.228 0.223 | 0.231 |
0.000 0.000 | 0.000 |
0.138 0.132 | 0.144 |
0.000 0.000 | 0.000 |
0.634 0.629 | 0.639 |
0.000 0.000 | 0.000 |
|||
| Plot | Lyso | Other | |||||||||||
| Expt C |
6 peptides |
109 spectra |
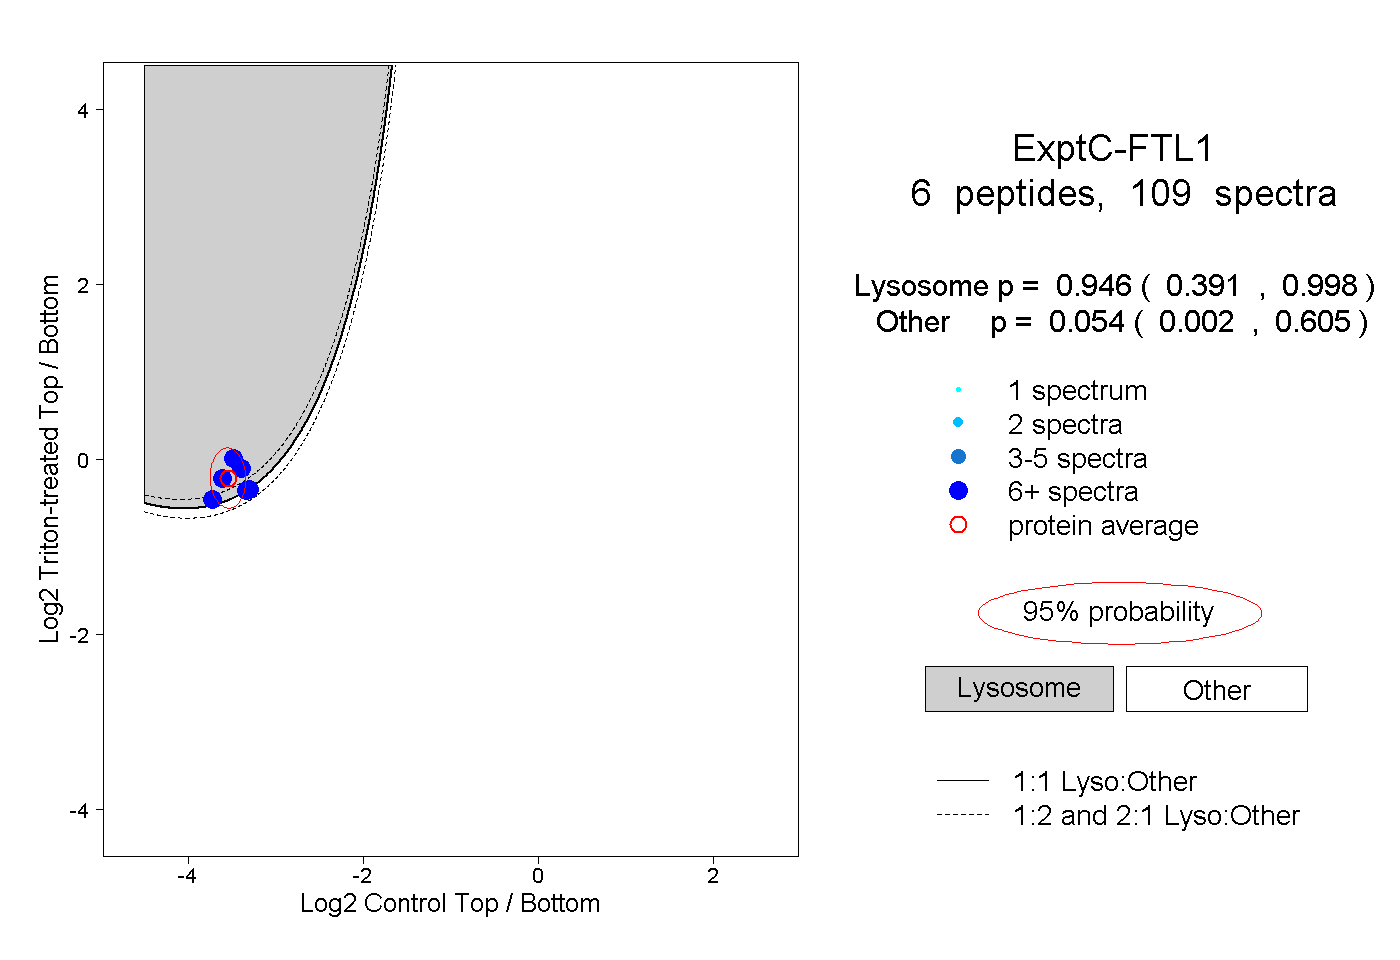 |
0.946 0.391 | 0.998 |
0.054 0.002 | 0.605 |
||||||||
| Plot | Lyso | Other | |||||||||||
| Expt D |
5 peptides |
16 spectra |
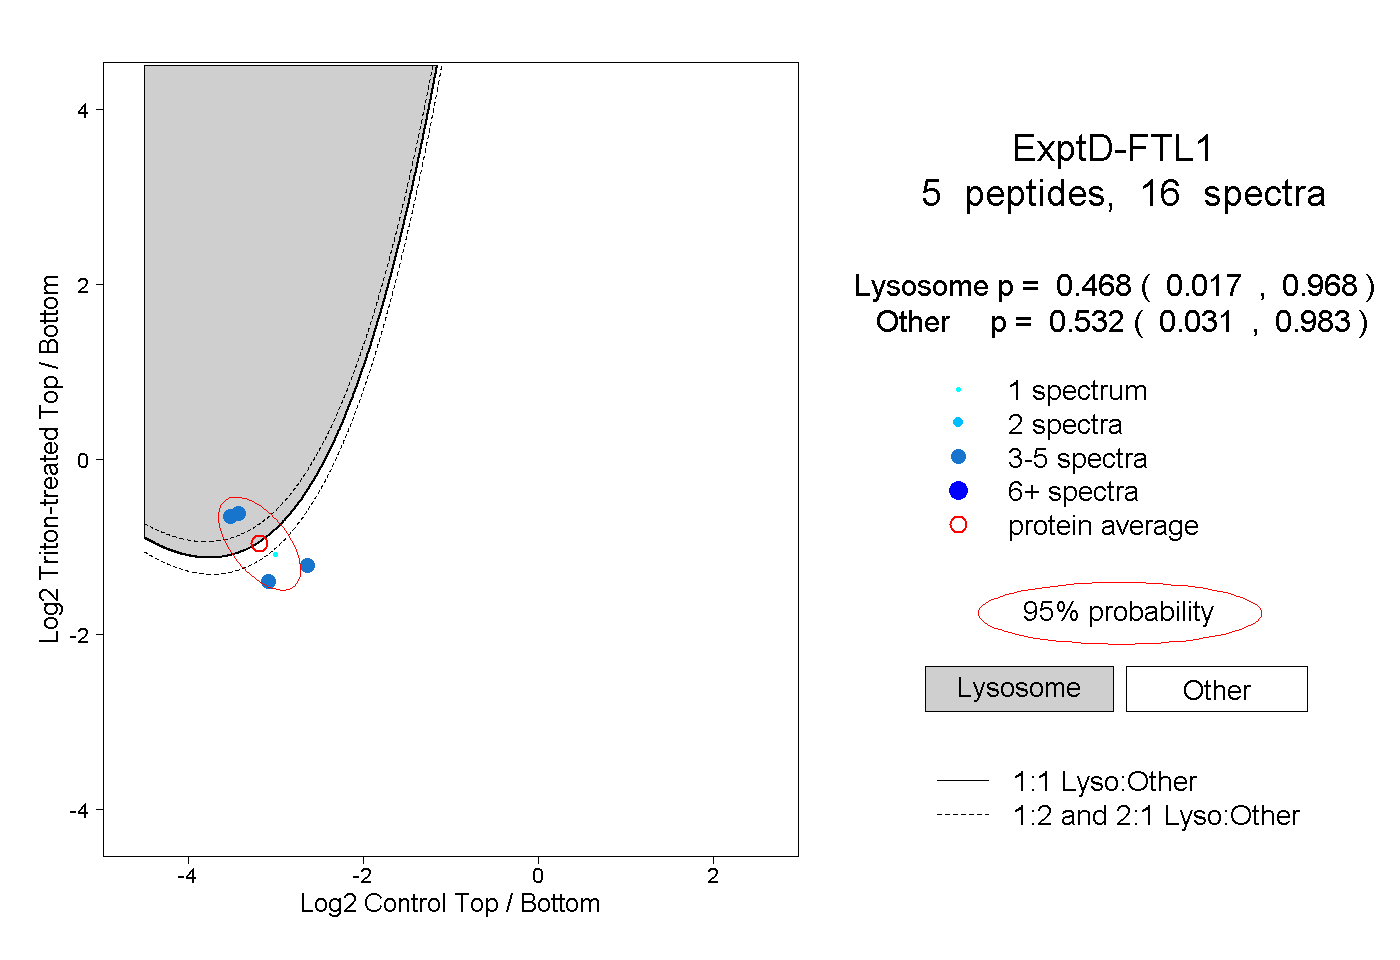 |
0.468 0.017 | 0.968 |
0.532 0.031 | 0.983 |