 8
8peptides
spectra
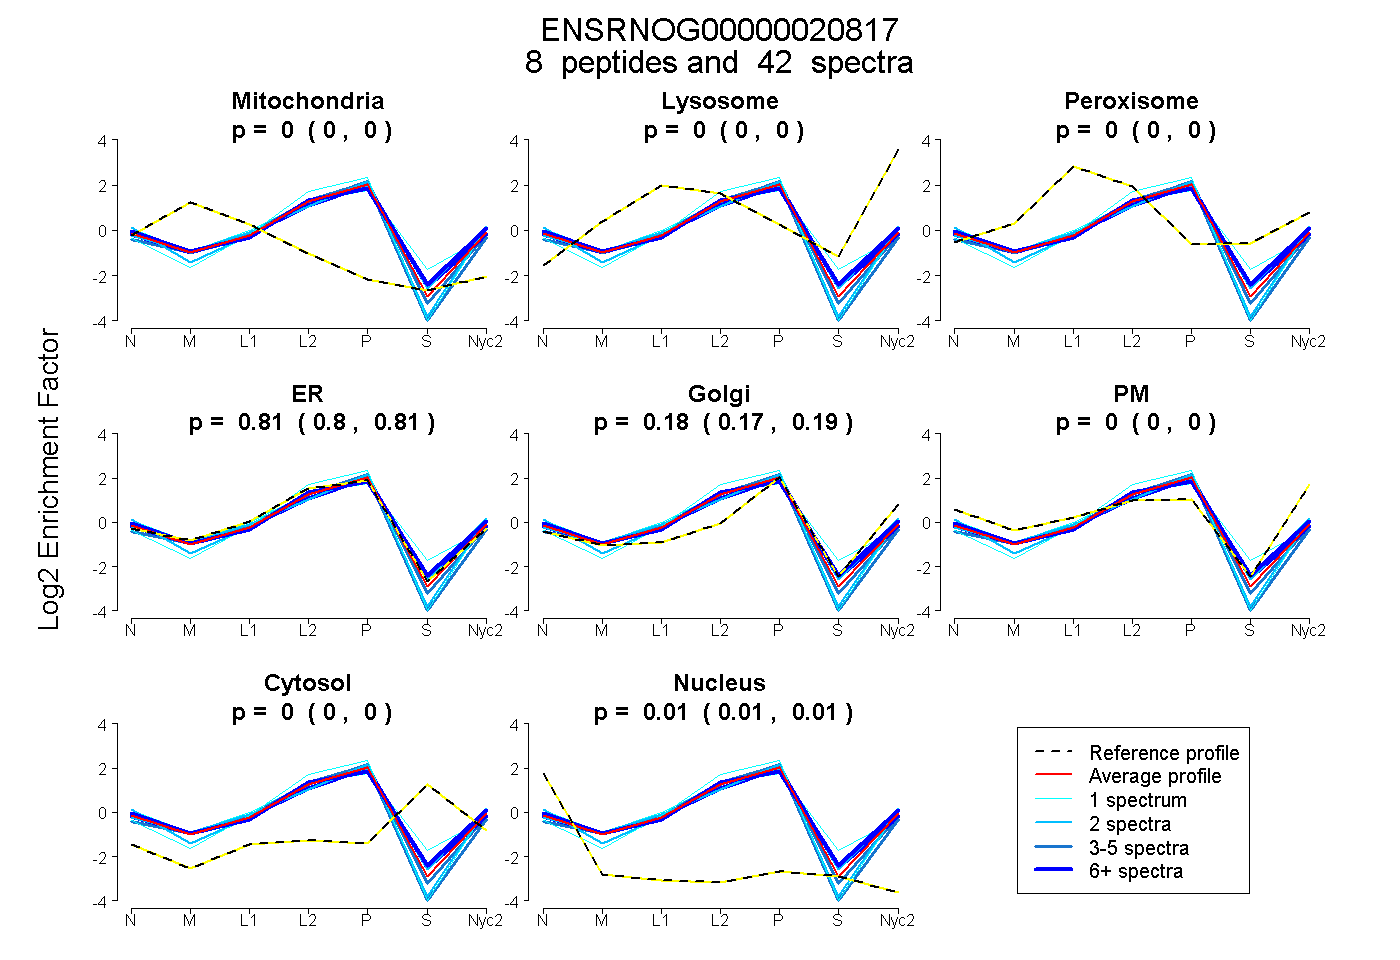
0.000 | 0.000
0.000 | 0.000
0.000 | 0.000
0.798 | 0.813
0.175 | 0.194
0.000 | 0.000
0.000 | 0.000
0.006 | 0.011
8peptides
spectra
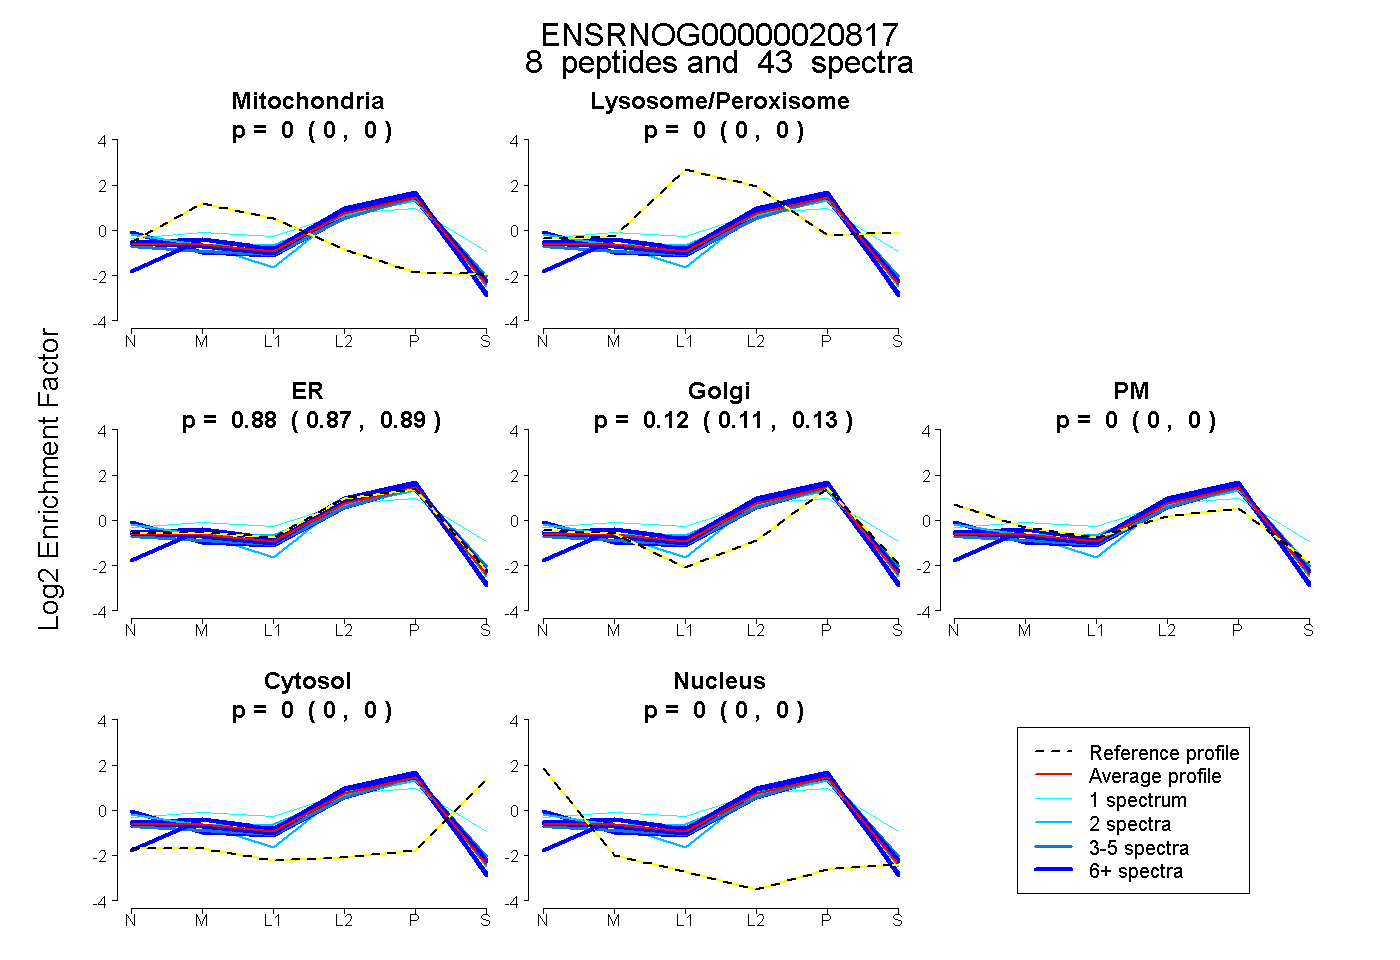
0.000 | 0.000
0.000 | 0.000
0.868 | 0.885
0.113 | 0.131
0.000 | 0.000
0.000 | 0.000
0.000 | 0.000
9peptides
spectra
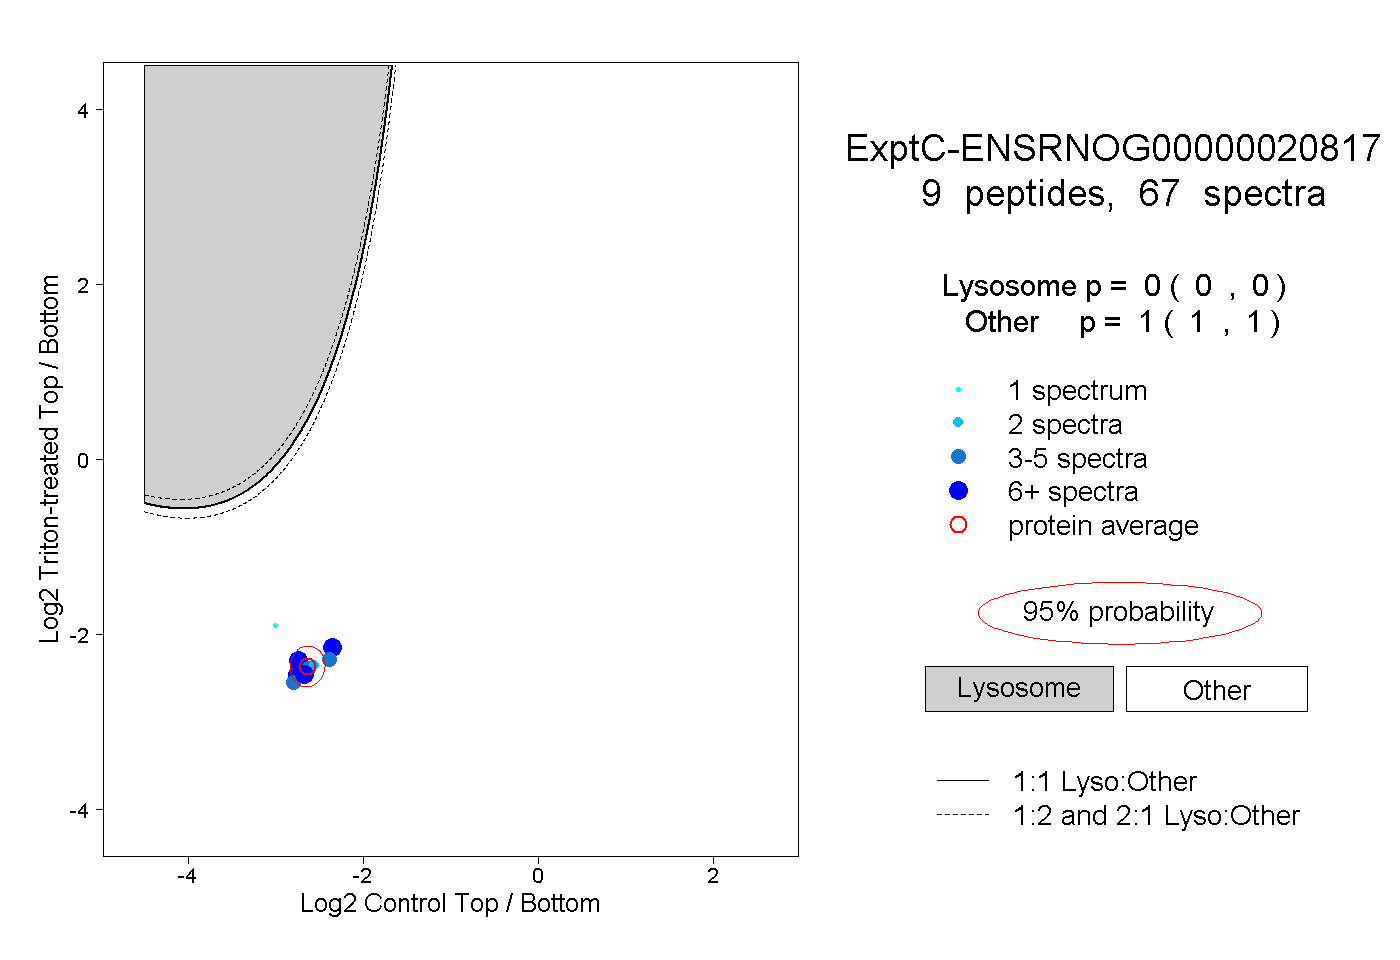
0.000 | 0.000
1.000 | 1.000
2peptides
spectra
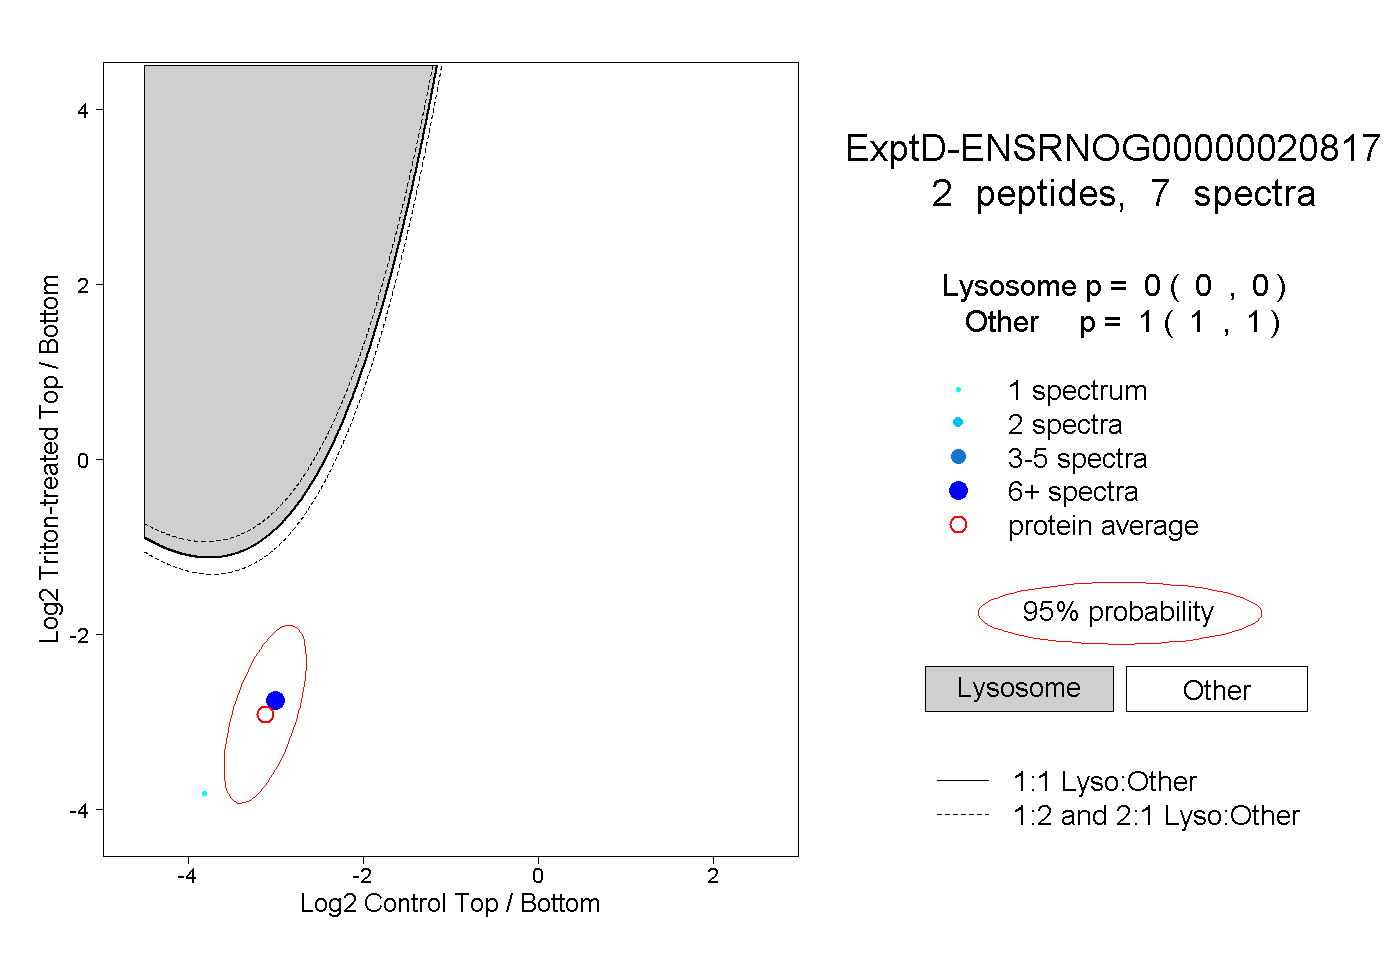
0.000 | 0.000
1.000 | 1.000