 8
8peptides
spectra
0.000 | 0.000
0.000 | 0.000
0.000 | 0.000
0.798 | 0.813
0.175 | 0.194
0.000 | 0.000
0.000 | 0.000
0.006 | 0.011
| Plot | Mito | Lyso | Perox | ER | Golgi | PM | Cytosol | Nucleus | |||||
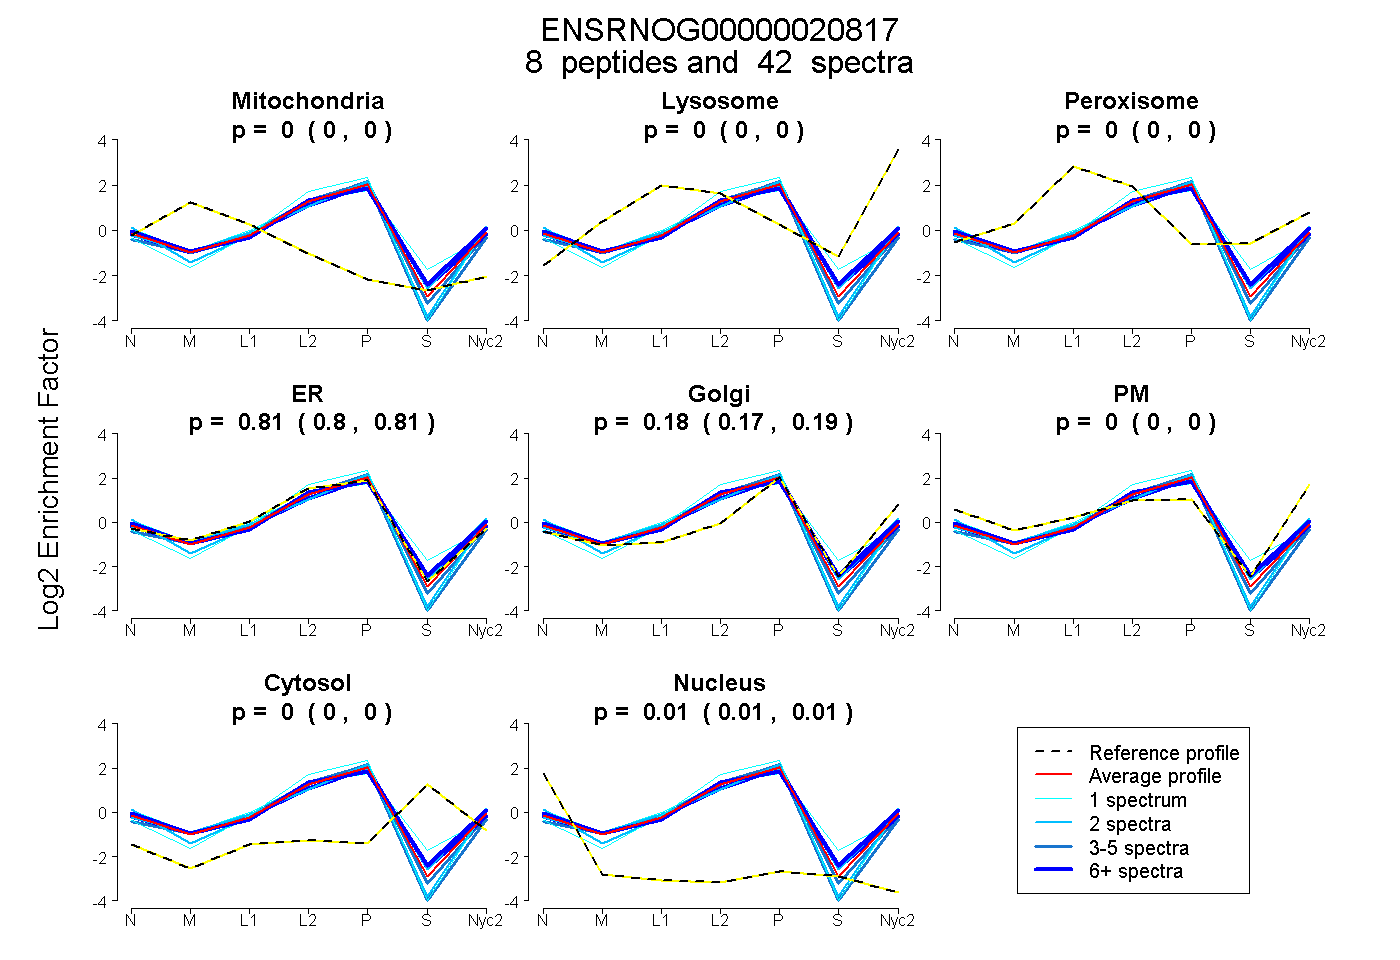
| Expt A |
8 peptides |
42 spectra |
|
0.000 0.000 | 0.000 |
0.000 0.000 | 0.000 |
0.000 0.000 | 0.000 |
0.806 0.798 | 0.813 |
0.185 0.175 | 0.194 |
0.000 0.000 | 0.000 |
0.000 0.000 | 0.000 |
0.009 0.006 | 0.011 |
| 19 spectra, VHEEIER | 0.000 | 0.000 | 0.000 | 0.737 | 0.140 | 0.097 | 0.021 | 0.005 | ||
| 1 spectrum, NAAFLPFSIGK | 0.000 | 0.000 | 0.000 | 0.936 | 0.064 | 0.000 | 0.000 | 0.000 | ||
| 5 spectra, DFNPQHFLDDK | 0.000 | 0.000 | 0.000 | 0.820 | 0.179 | 0.000 | 0.000 | 0.001 | ||
| 2 spectra, GTDVFPIIGSLMTEPK | 0.000 | 0.000 | 0.000 | 0.696 | 0.215 | 0.076 | 0.000 | 0.012 | ||
| 8 spectra, FFPNHK | 0.000 | 0.000 | 0.000 | 0.772 | 0.200 | 0.000 | 0.009 | 0.019 | ||
| 4 spectra, GELPTFNILFK | 0.000 | 0.000 | 0.000 | 0.952 | 0.021 | 0.000 | 0.000 | 0.027 | ||
| 2 spectra, IVVLYGYDAVK | 0.000 | 0.000 | 0.000 | 0.742 | 0.258 | 0.000 | 0.000 | 0.000 | ||
| 1 spectrum, FCLGDSLAK | 0.000 | 0.000 | 0.022 | 0.807 | 0.000 | 0.067 | 0.104 | 0.000 |
| Plot | Mito | Lyso or Perox | ER | Golgi | PM | Cytosol | Nucleus | ||||||
| Expt B |
8 peptides |
43 spectra |
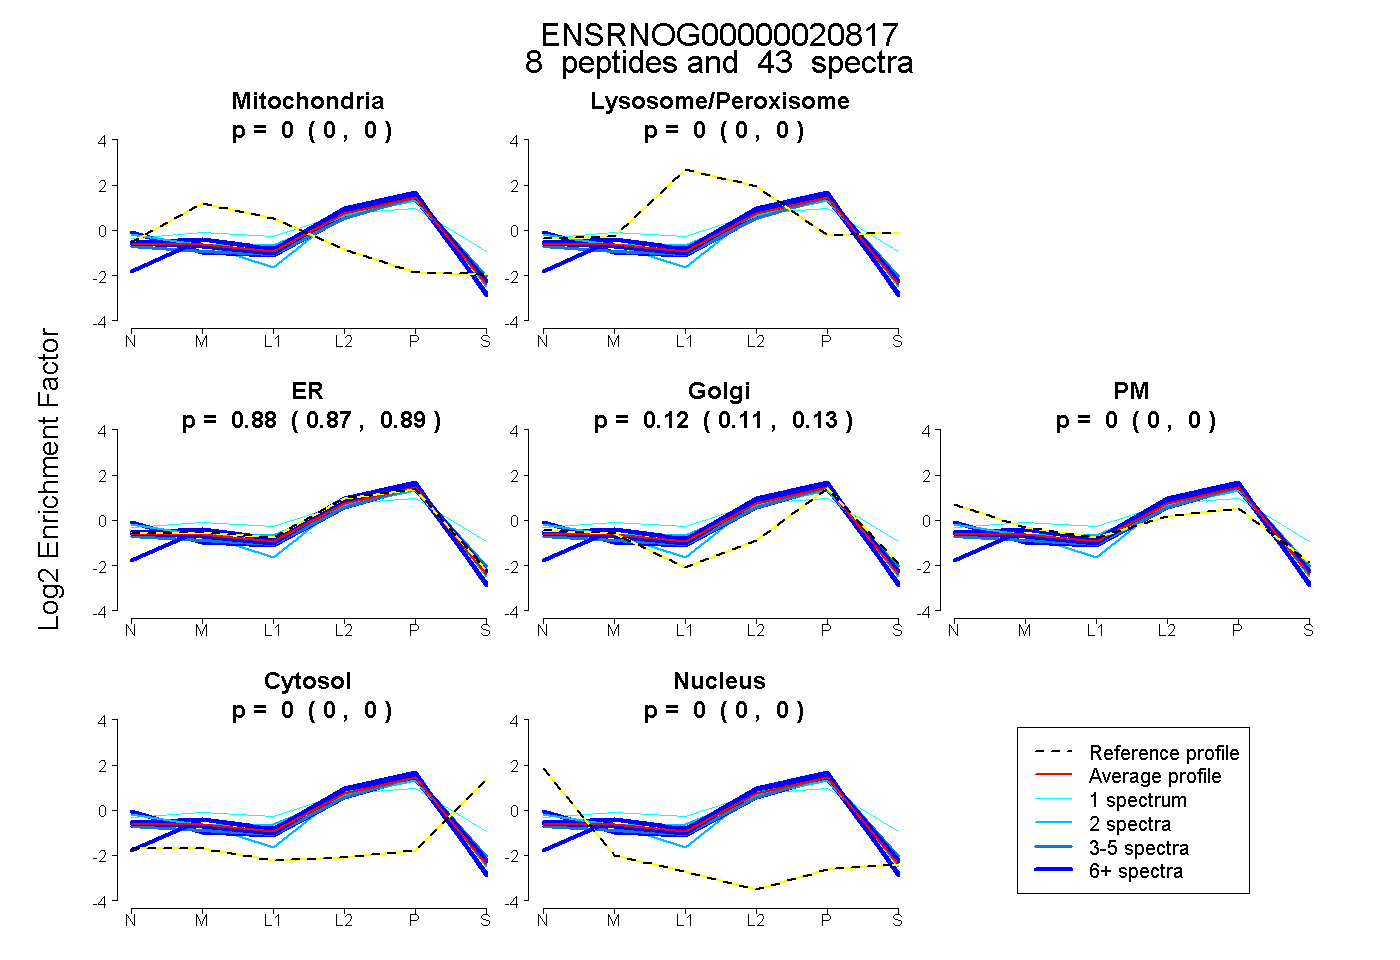 |
0.000 0.000 | 0.000 |
0.000 0.000 | 0.000 |
0.877 0.868 | 0.885 |
0.123 0.113 | 0.131 |
0.000 0.000 | 0.000 |
0.000 0.000 | 0.000 |
0.000 0.000 | 0.000 |
|||
| Plot | Lyso | Other | |||||||||||
| Expt C |
9 peptides |
67 spectra |
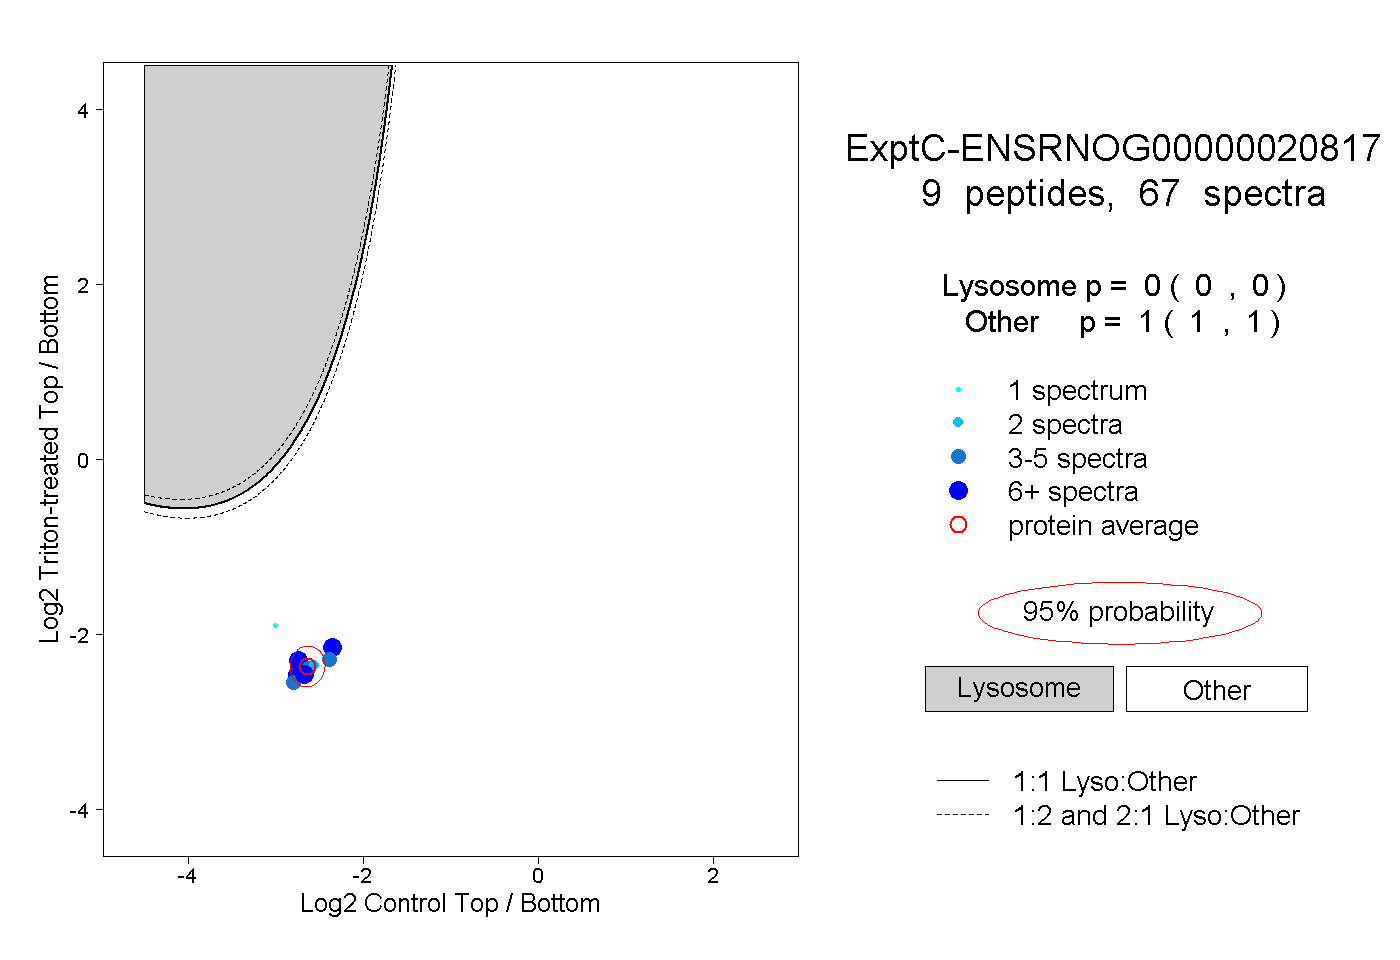 |
0.000 0.000 | 0.000 |
1.000 1.000 | 1.000 |
||||||||
| Plot | Lyso | Other | |||||||||||
| Expt D |
2 peptides |
7 spectra |
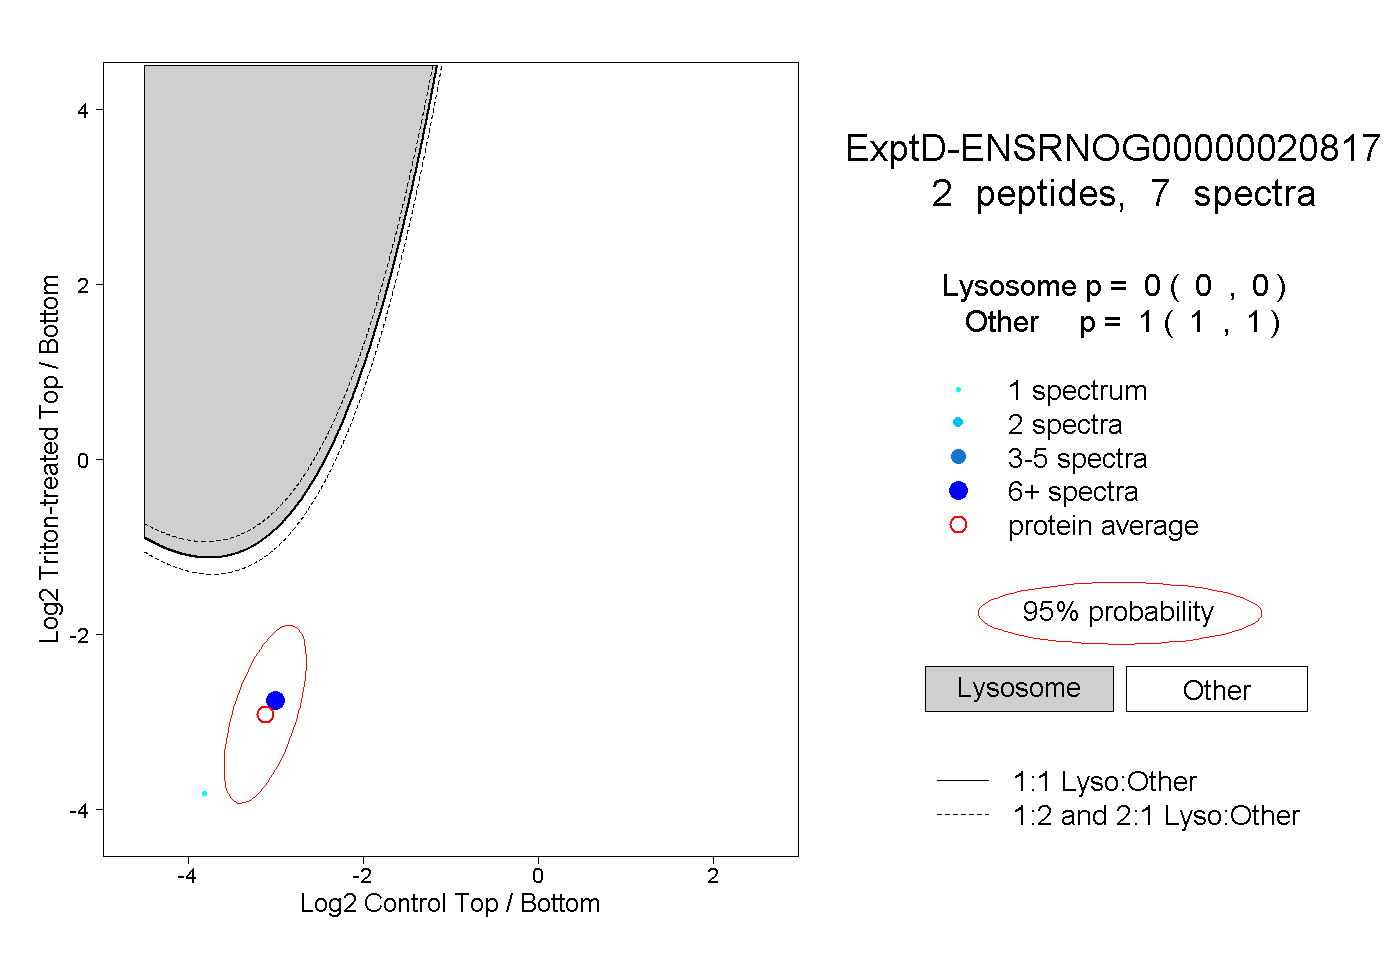 |
0.000 0.000 | 0.000 |
1.000 1.000 | 1.000 |