 13
13peptides
spectra
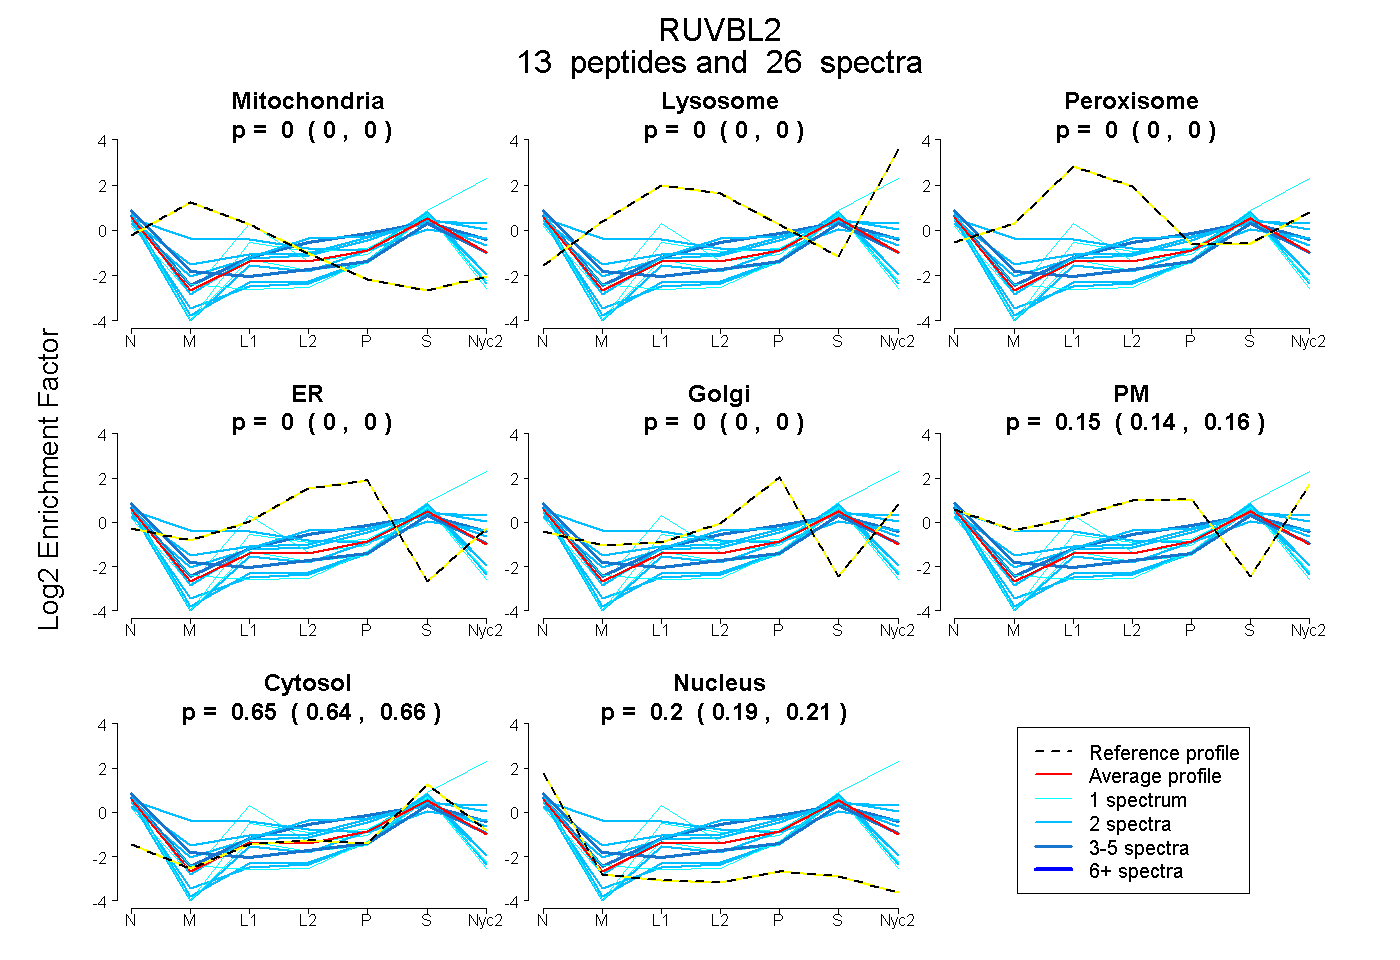
0.000 | 0.000
0.000 | 0.000
0.000 | 0.000
0.000 | 0.000
0.000 | 0.000
0.136 | 0.158
0.642 | 0.655
0.191 | 0.212
6peptides
spectra
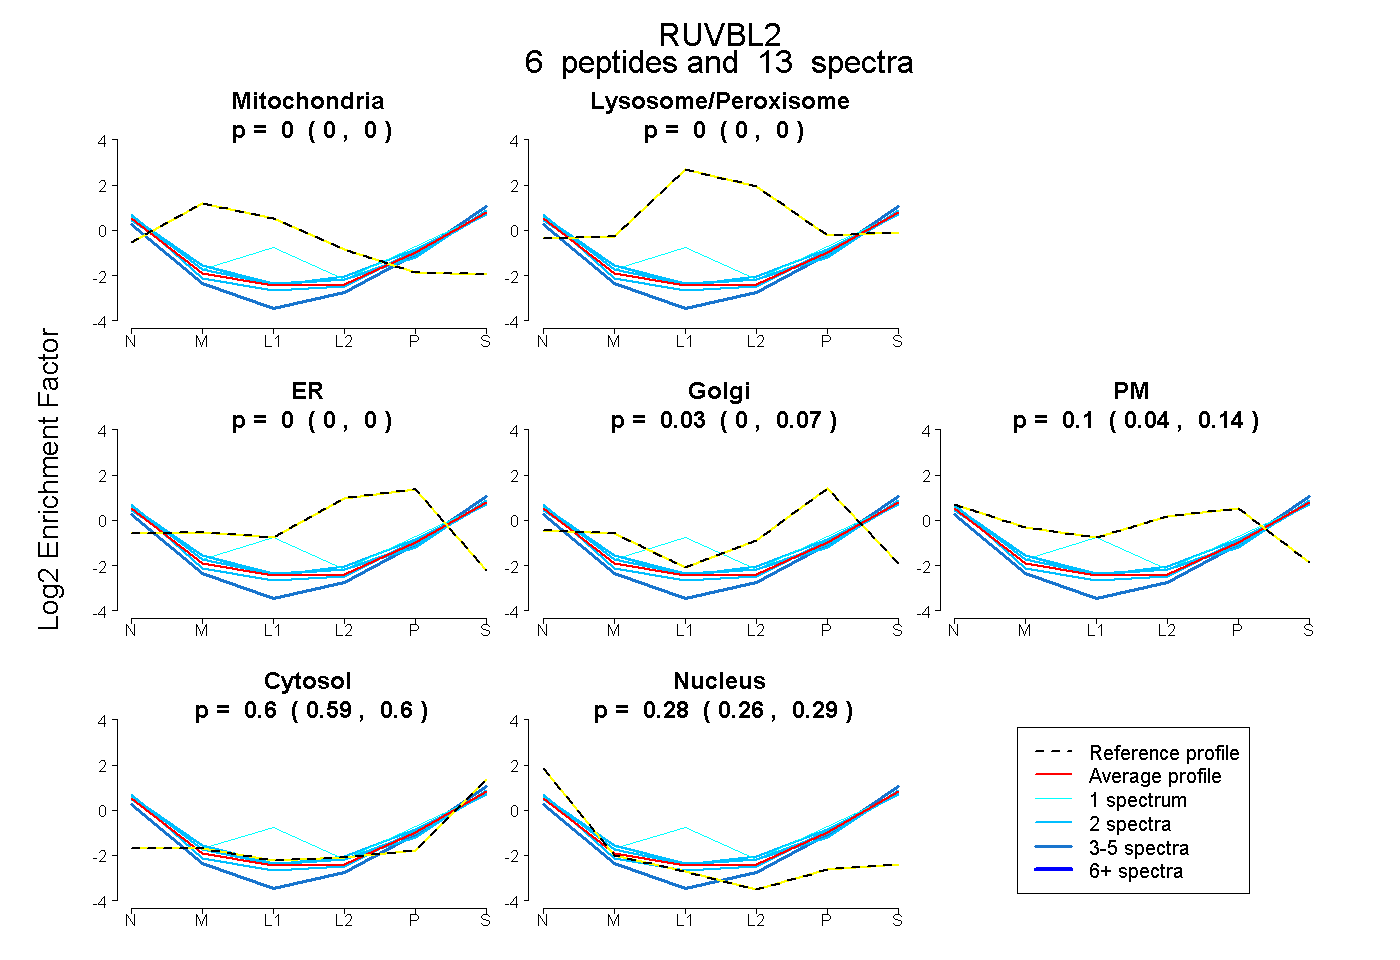
0.000 | 0.000
0.000 | 0.000
0.000 | 0.000
0.000 | 0.073
0.038 | 0.137
0.587 | 0.602
0.261 | 0.291
5peptides
spectra
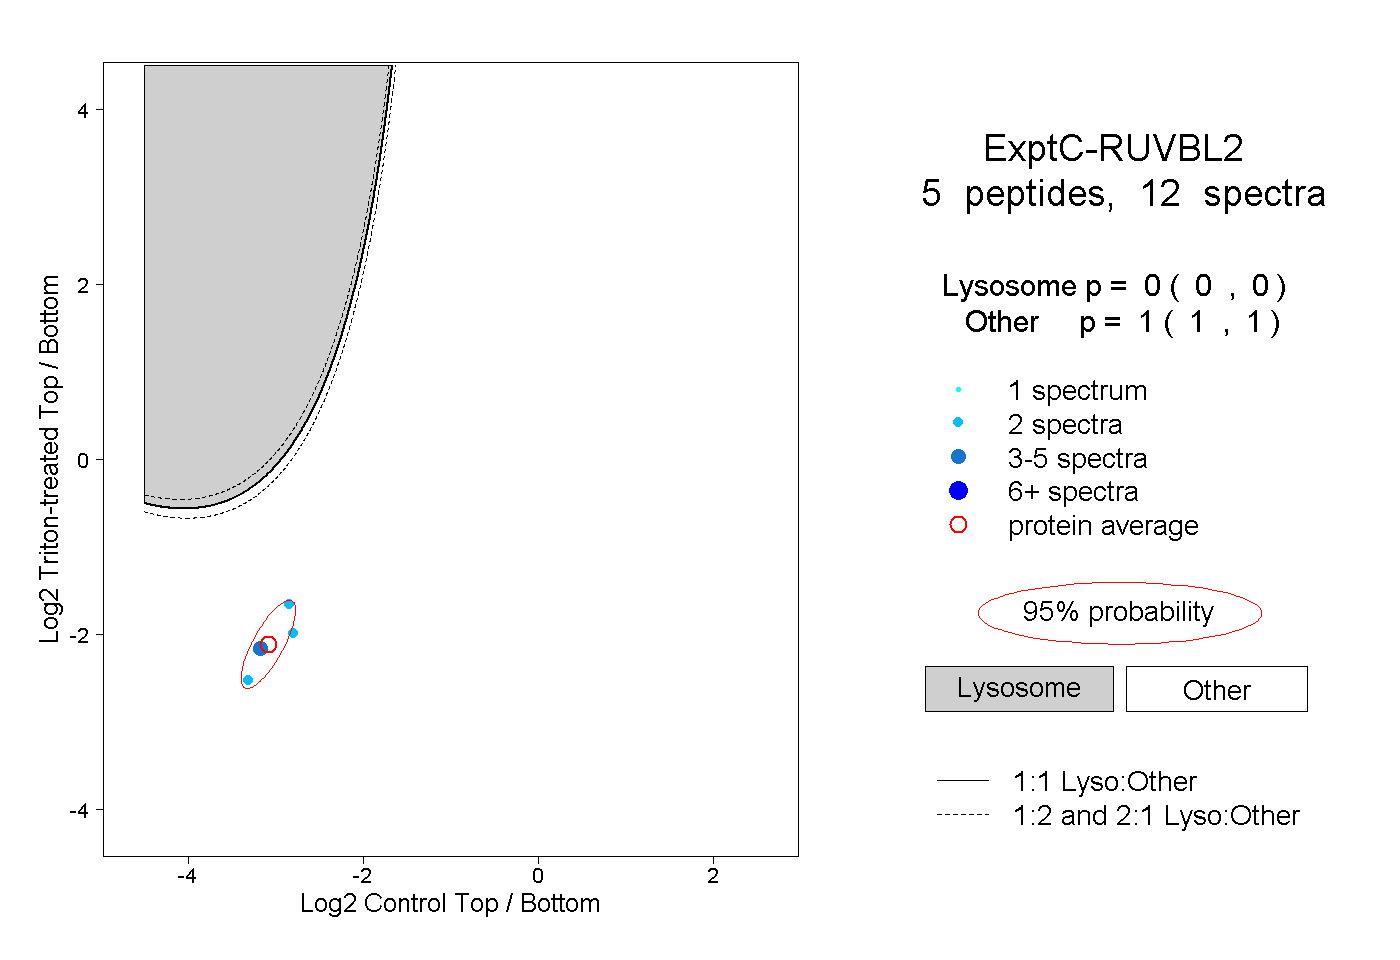
0.000 | 0.000
1.000 | 1.000