 13
13peptides
spectra
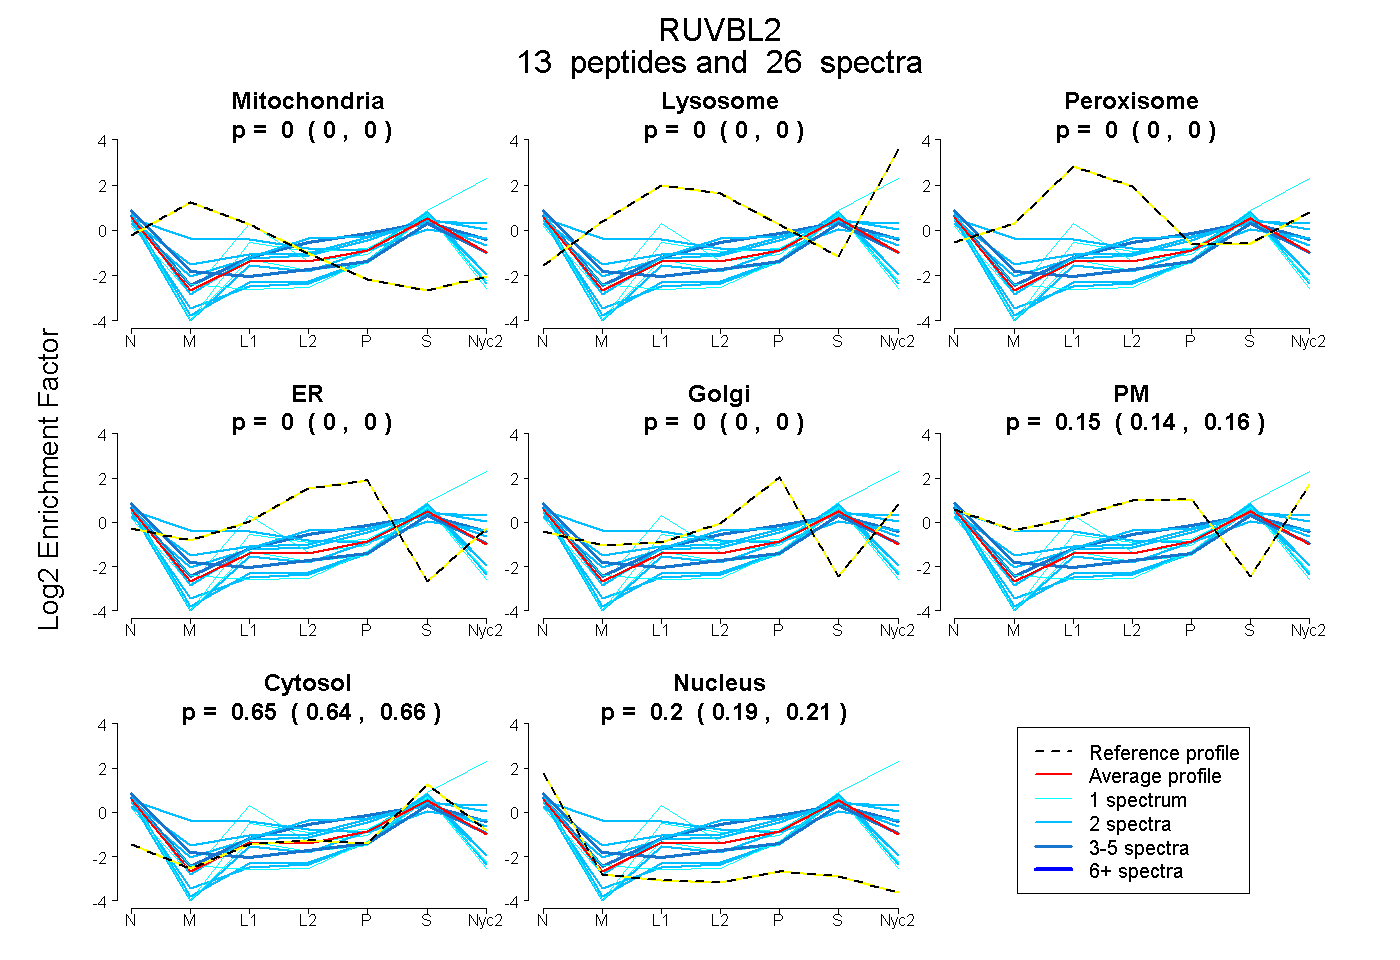
0.000 | 0.000
0.000 | 0.000
0.000 | 0.000
0.000 | 0.000
0.000 | 0.000
0.136 | 0.158
0.642 | 0.655
0.191 | 0.212
| Plot | Mito | Lyso | Perox | ER | Golgi | PM | Cytosol | Nucleus | |||||
| Expt A |
13 peptides |
26 spectra |
|
0.000 0.000 | 0.000 |
0.000 0.000 | 0.000 |
0.000 0.000 | 0.000 |
0.000 0.000 | 0.000 |
0.000 0.000 | 0.000 |
0.148 0.136 | 0.158 |
0.649 0.642 | 0.655 |
0.202 0.191 | 0.212 |
| 2 spectra, TEALTQAFR | 0.189 | 0.000 | 0.135 | 0.000 | 0.000 | 0.209 | 0.407 | 0.061 | ||
| 2 spectra, AAGVVLEMIR | 0.000 | 0.000 | 0.000 | 0.000 | 0.000 | 0.000 | 0.653 | 0.347 | ||
| 1 spectrum, FVQCPDGELQK | 0.000 | 0.000 | 0.049 | 0.073 | 0.000 | 0.000 | 0.627 | 0.250 | ||
| 2 spectra, ALESDMAPVLIMATNR | 0.000 | 0.000 | 0.000 | 0.000 | 0.000 | 0.288 | 0.639 | 0.073 | ||
| 2 spectra, EYQDAFLFNELK | 0.000 | 0.000 | 0.000 | 0.000 | 0.000 | 0.000 | 0.696 | 0.304 | ||
| 2 spectra, QASQGMVGQLAAR | 0.000 | 0.000 | 0.000 | 0.069 | 0.000 | 0.228 | 0.574 | 0.129 | ||
| 4 spectra, IGAHSHIR | 0.000 | 0.000 | 0.000 | 0.000 | 0.000 | 0.317 | 0.574 | 0.109 | ||
| 2 spectra, GLGLDDALEPR | 0.000 | 0.000 | 0.000 | 0.000 | 0.000 | 0.000 | 0.626 | 0.374 | ||
| 1 spectrum, DYDAMGSQTK | 0.000 | 0.319 | 0.000 | 0.000 | 0.000 | 0.041 | 0.639 | 0.000 | ||
| 2 spectra, STQYMK | 0.000 | 0.000 | 0.000 | 0.000 | 0.000 | 0.367 | 0.587 | 0.045 | ||
| 4 spectra, VYSLFLDESR | 0.000 | 0.000 | 0.000 | 0.000 | 0.000 | 0.144 | 0.562 | 0.294 | ||
| 1 spectrum, TTEMETIYDLGTK | 0.000 | 0.000 | 0.000 | 0.000 | 0.000 | 0.000 | 0.601 | 0.399 | ||
| 1 spectrum, LLIVSTSPYSEK | 0.000 | 0.000 | 0.000 | 0.000 | 0.000 | 0.000 | 0.663 | 0.337 |
| Plot | Mito | Lyso or Perox | ER | Golgi | PM | Cytosol | Nucleus | ||||||
| Expt B |
6 peptides |
13 spectra |
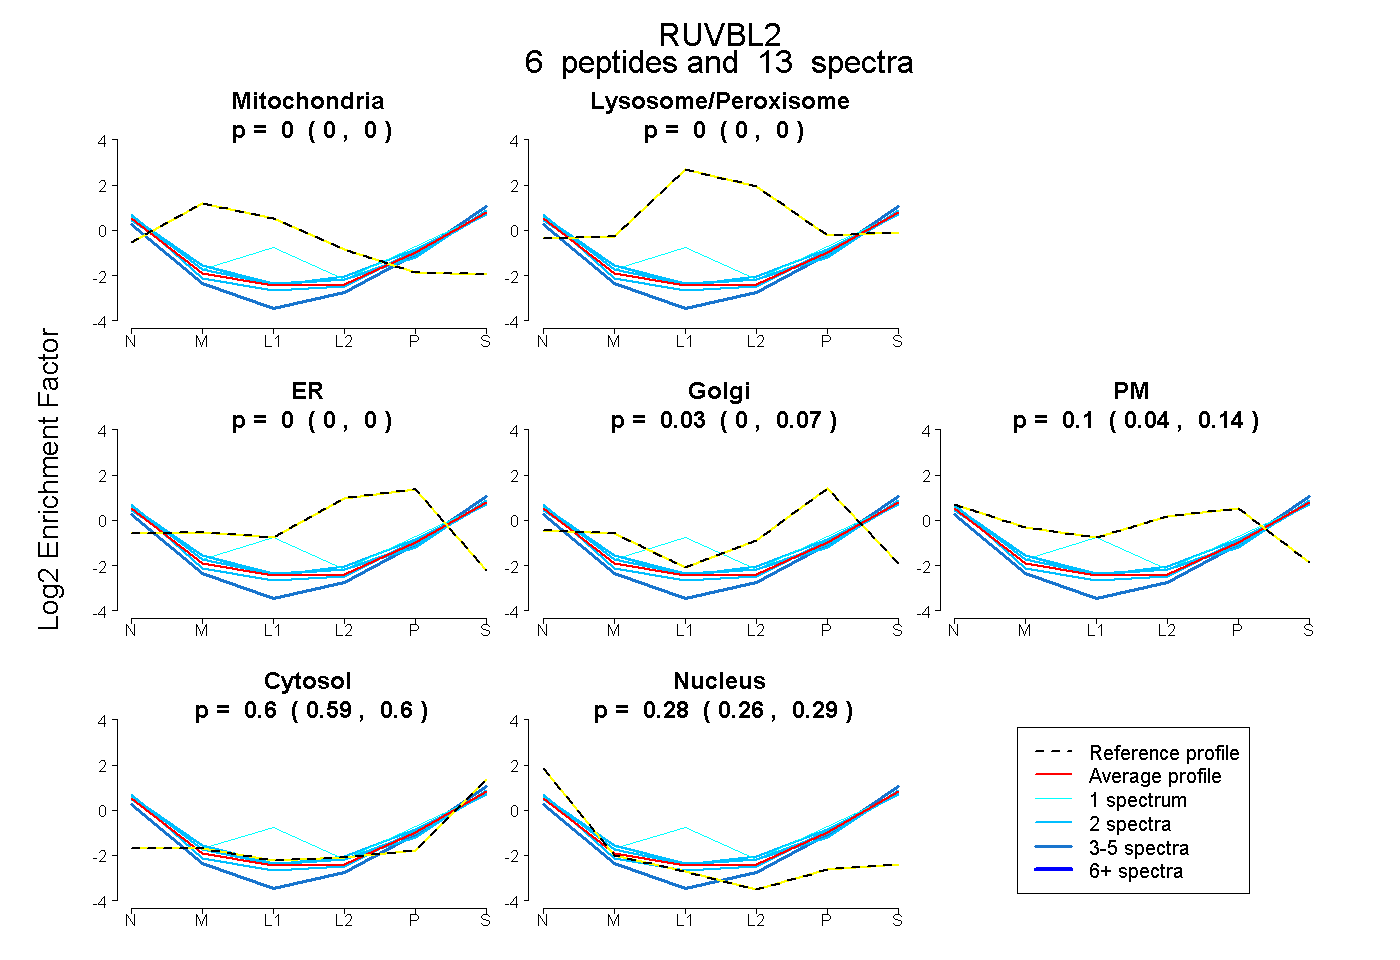 |
0.000 0.000 | 0.000 |
0.000 0.000 | 0.000 |
0.000 0.000 | 0.000 |
0.031 0.000 | 0.073 |
0.096 0.038 | 0.137 |
0.596 0.587 | 0.602 |
0.277 0.261 | 0.291 |
|||
| Plot | Lyso | Other | |||||||||||
| Expt C |
5 peptides |
12 spectra |
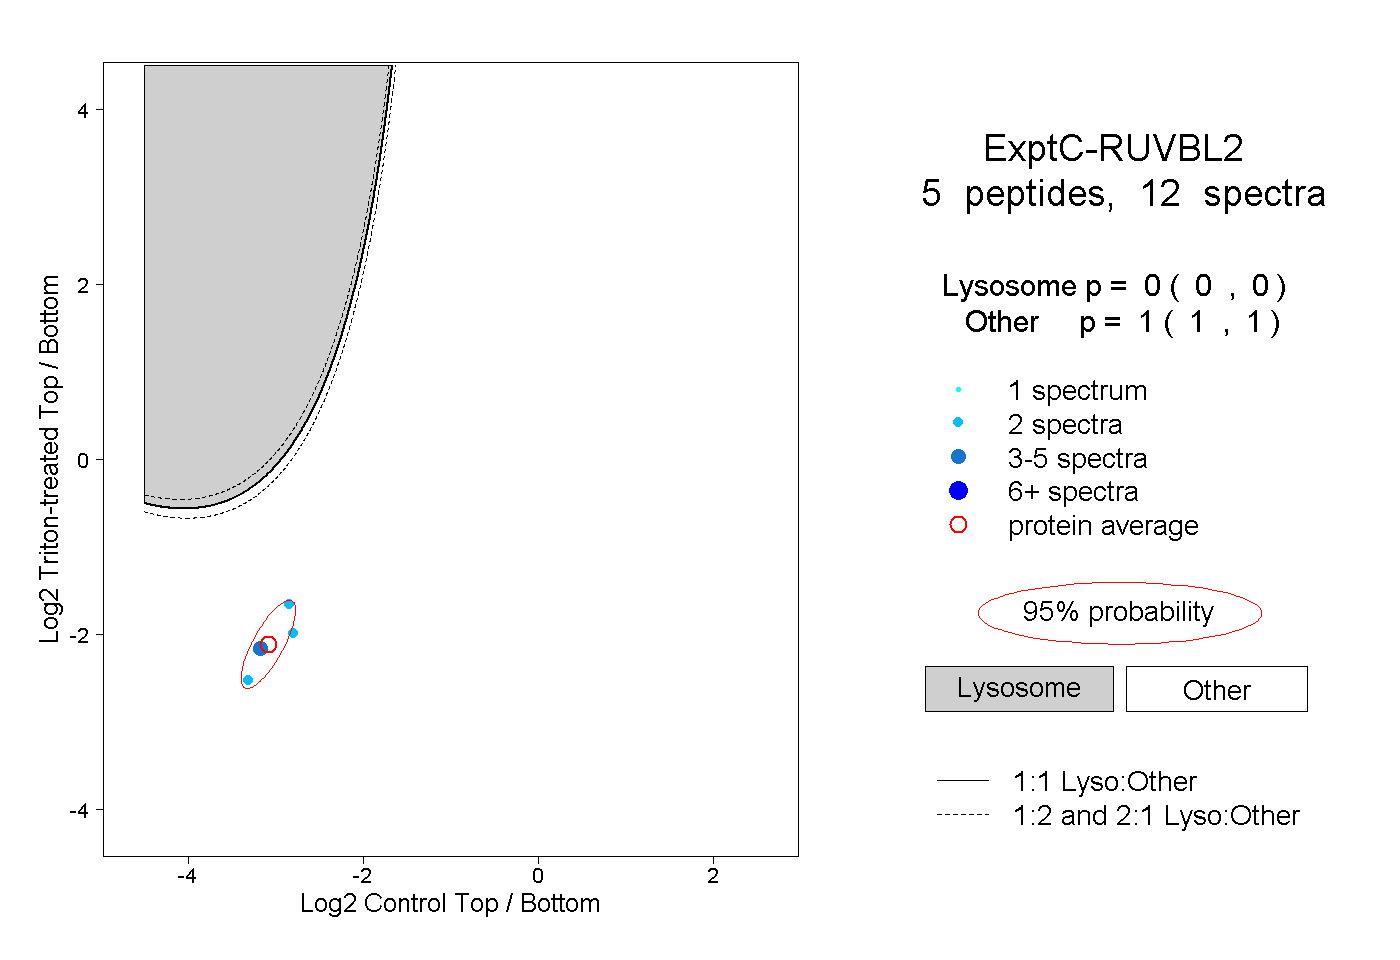 |
0.000 0.000 | 0.000 |
1.000 1.000 | 1.000 |