 10
10peptides
spectra
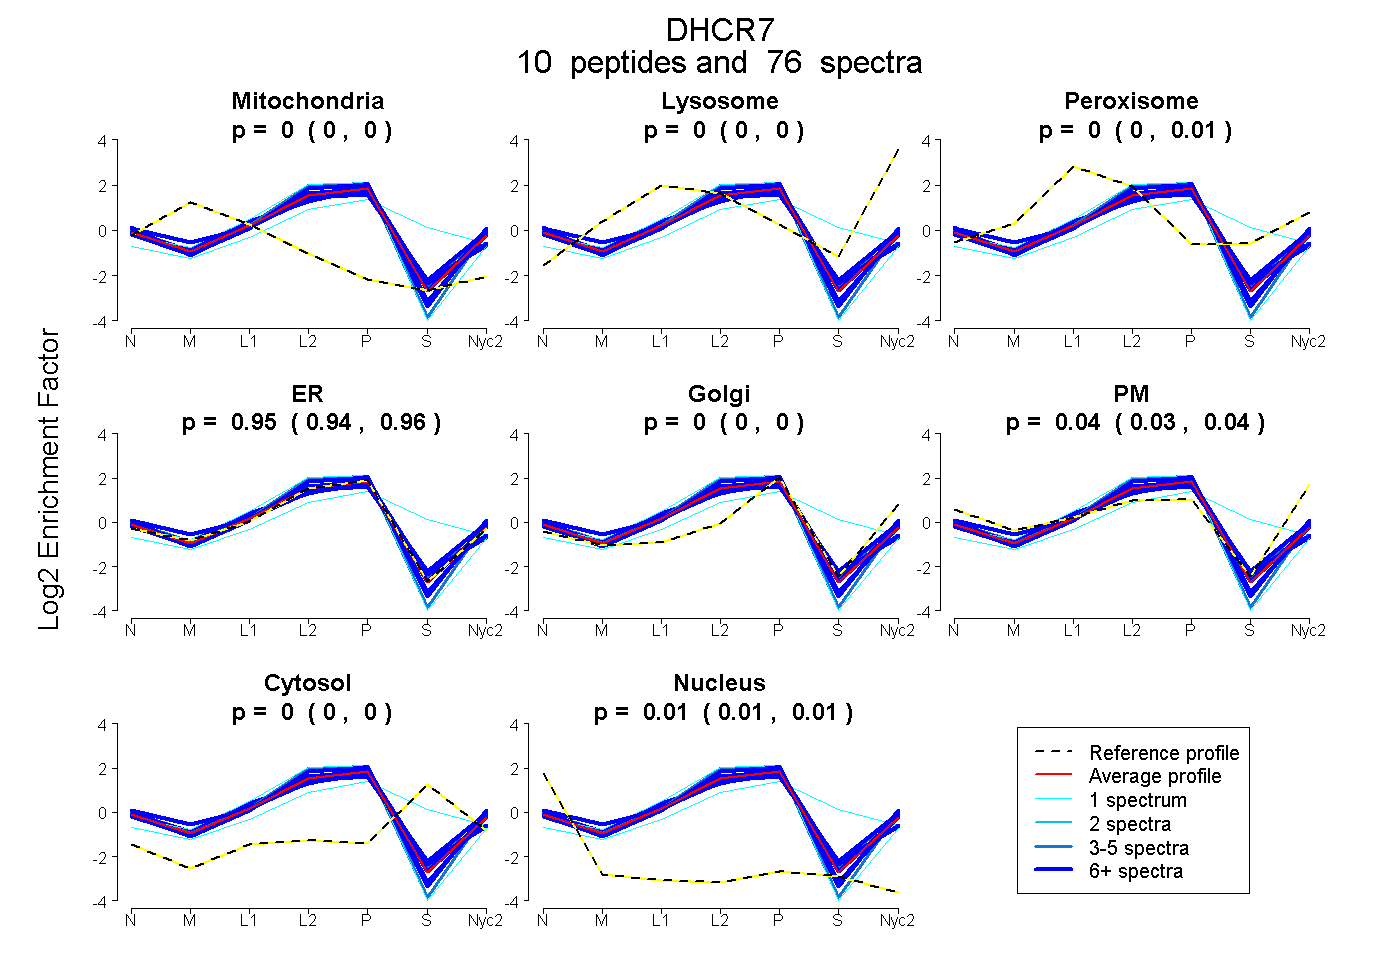
0.000 | 0.000
0.000 | 0.000
0.000 | 0.009
0.943 | 0.958
0.000 | 0.000
0.027 | 0.045
0.000 | 0.000
0.006 | 0.009
8peptides
spectra
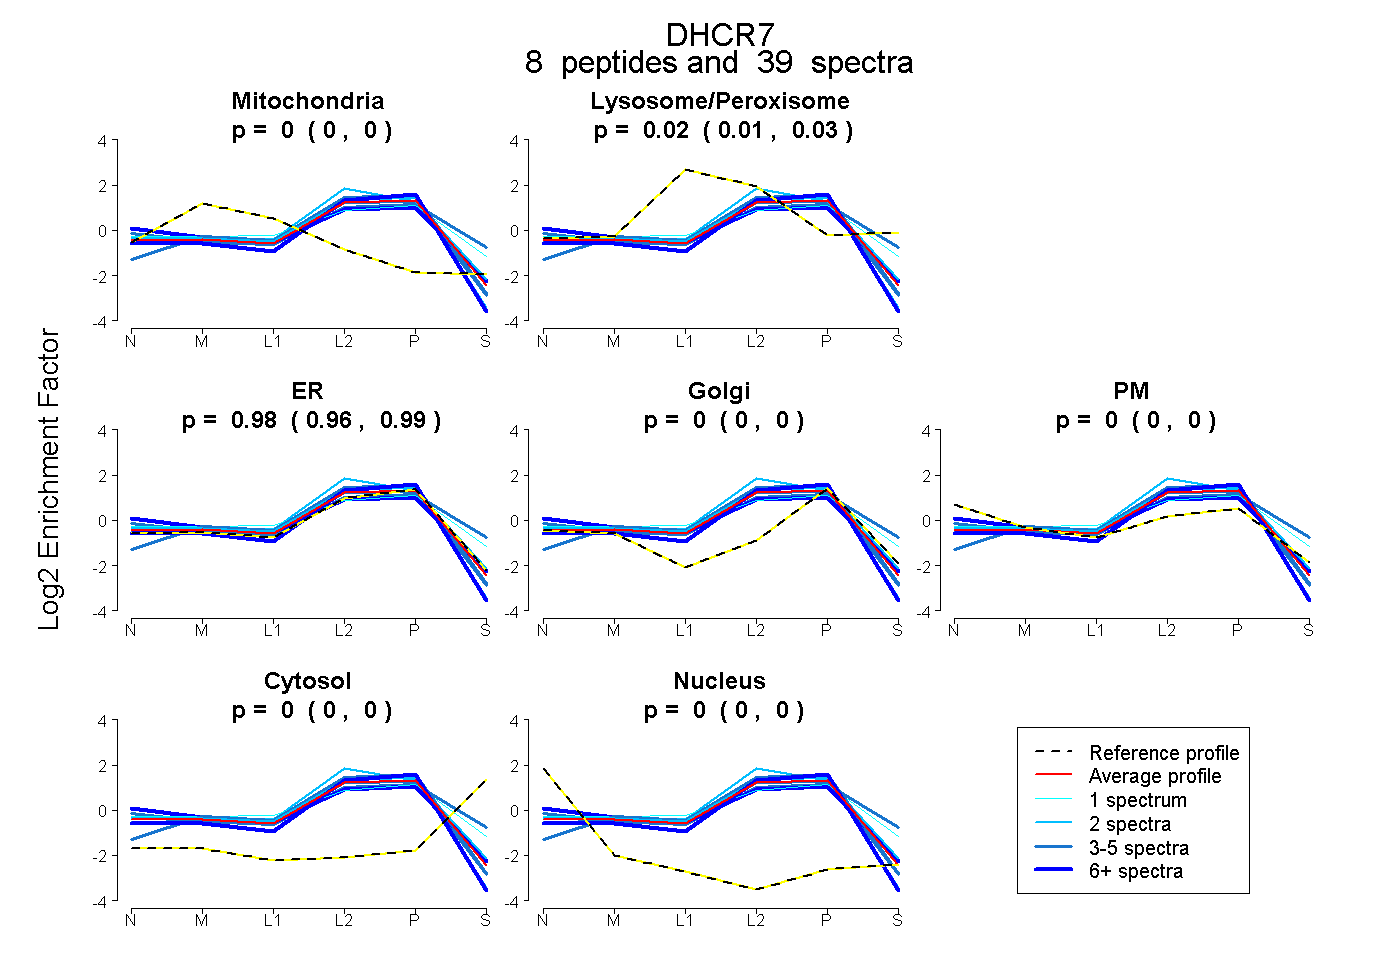
0.000 | 0.000
0.010 | 0.034
0.964 | 0.988
0.000 | 0.000
0.000 | 0.000
0.000 | 0.000
0.000 | 0.000
8peptides
spectra
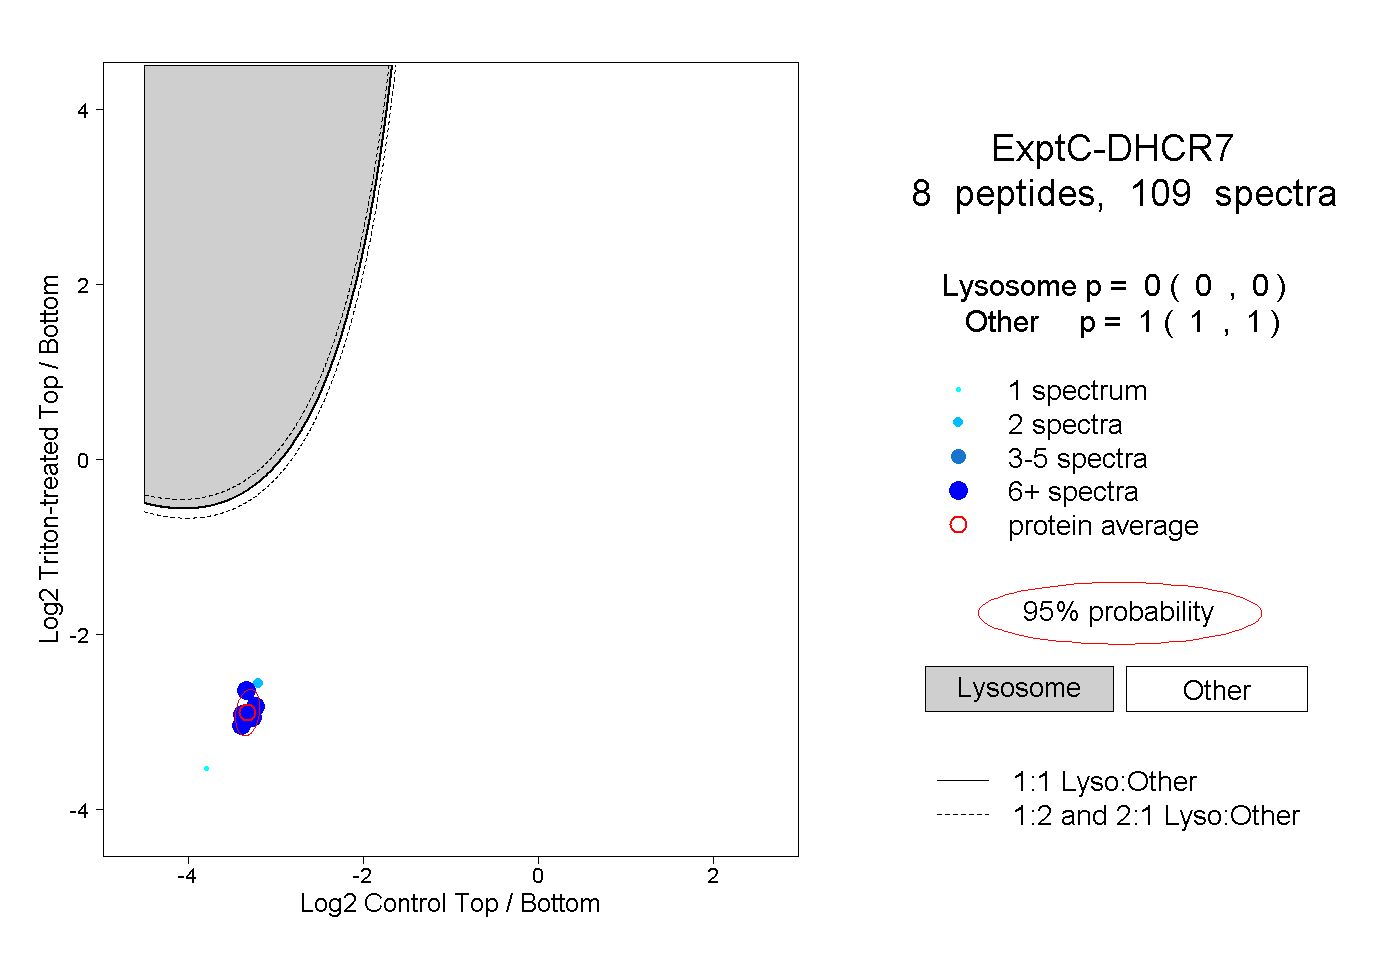
0.000 | 0.000
1.000 | 1.000
4peptides
spectra
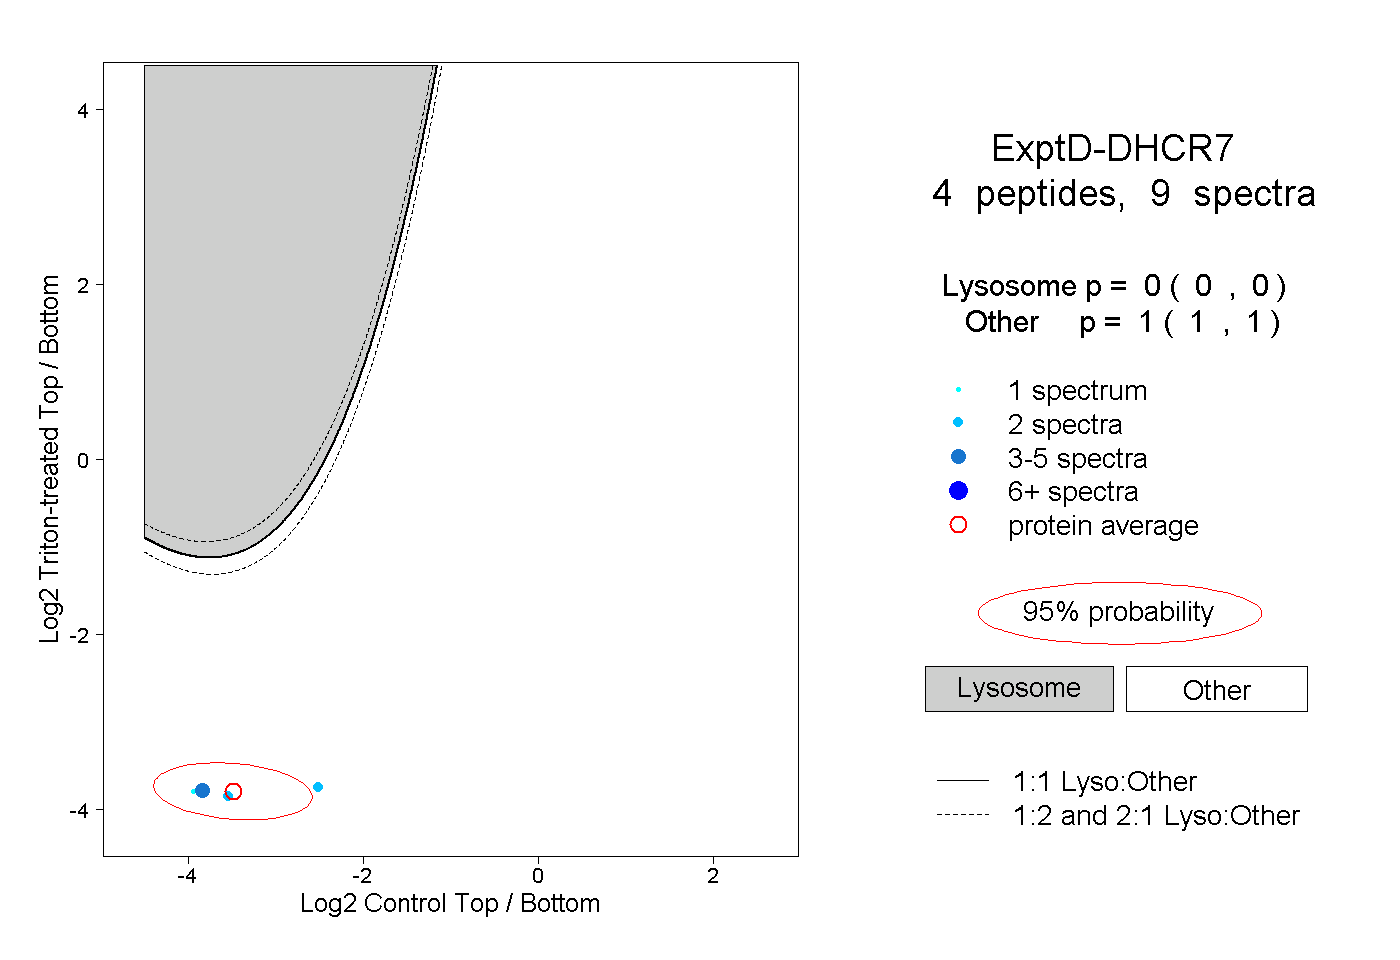
0.000 | 0.000
1.000 | 1.000