 10
10peptides
spectra
0.000 | 0.000
0.000 | 0.000
0.000 | 0.009
0.943 | 0.958
0.000 | 0.000
0.027 | 0.045
0.000 | 0.000
0.006 | 0.009
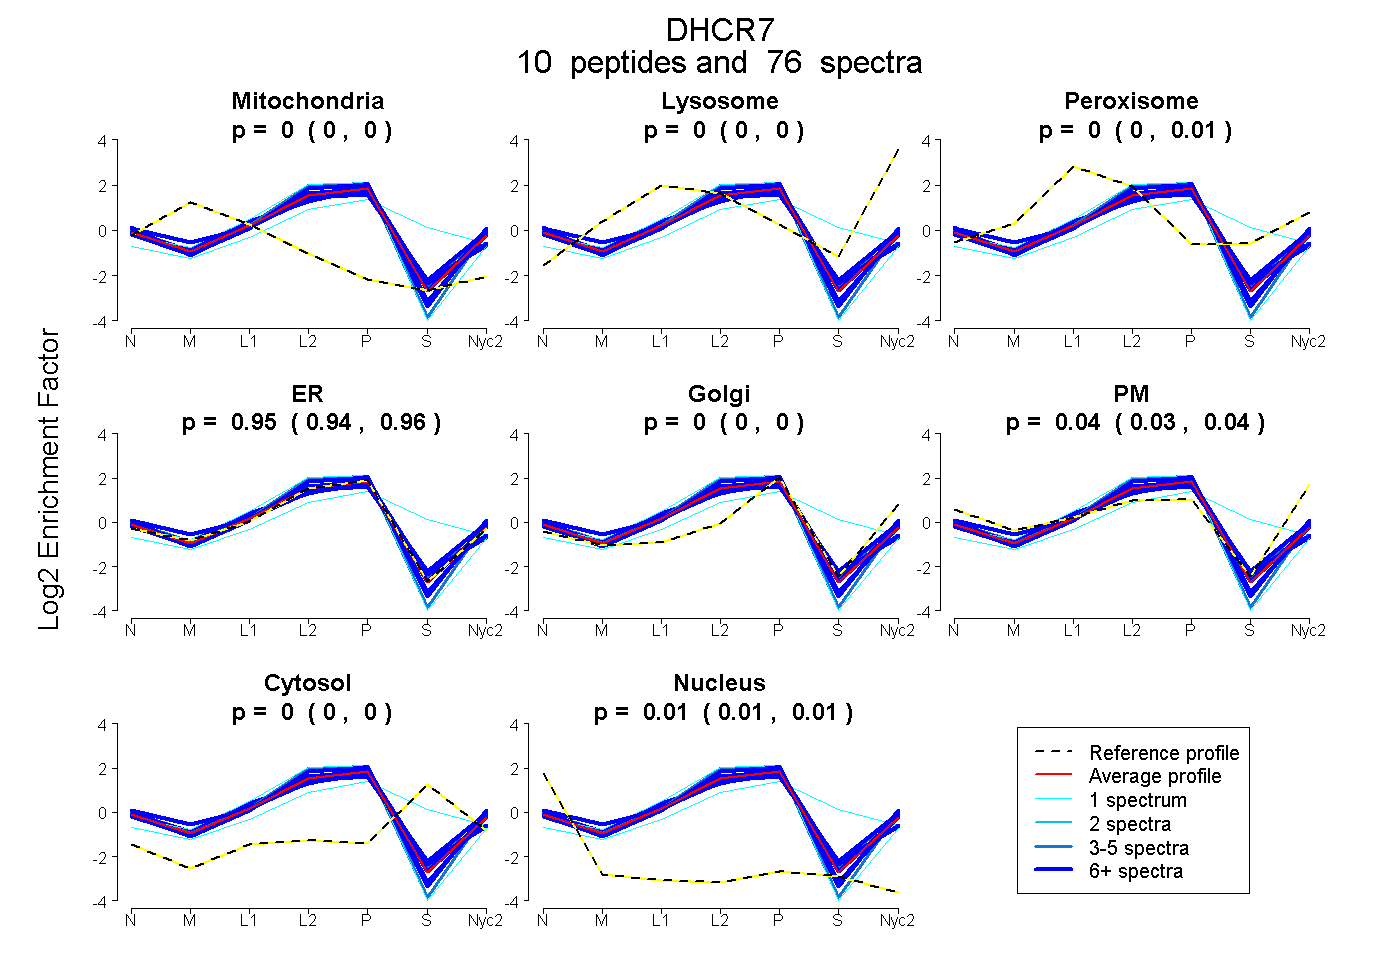
| Plot | Mito | Lyso | Perox | ER | Golgi | PM | Cytosol | Nucleus | |||||
| Expt A |
10 peptides |
76 spectra |
|
0.000 0.000 | 0.000 |
0.000 0.000 | 0.000 |
0.004 0.000 | 0.009 |
0.951 0.943 | 0.958 |
0.000 0.000 | 0.000 |
0.037 0.027 | 0.045 |
0.000 0.000 | 0.000 |
0.008 0.006 | 0.009 |
| 20 spectra, YVAAVPYR | 0.000 | 0.000 | 0.000 | 0.968 | 0.032 | 0.000 | 0.000 | 0.000 | ||
| 5 spectra, AIECSYTSADGLK | 0.000 | 0.000 | 0.059 | 0.779 | 0.000 | 0.153 | 0.000 | 0.009 | ||
| 1 spectrum, TDGHCLIWGK | 0.000 | 0.000 | 0.000 | 1.000 | 0.000 | 0.000 | 0.000 | 0.000 | ||
| 9 spectra, TPPVTAK | 0.000 | 0.000 | 0.066 | 0.751 | 0.000 | 0.157 | 0.014 | 0.013 | ||
| 16 spectra, SQHNASK | 0.000 | 0.000 | 0.044 | 0.889 | 0.000 | 0.000 | 0.016 | 0.051 | ||
| 1 spectrum, AESQGQWGR | 0.000 | 0.000 | 0.085 | 0.534 | 0.000 | 0.000 | 0.381 | 0.000 | ||
| 7 spectra, MTNHQK | 0.000 | 0.000 | 0.000 | 0.941 | 0.000 | 0.059 | 0.000 | 0.000 | ||
| 6 spectra, GYLFPTSAEDCK | 0.000 | 0.000 | 0.058 | 0.911 | 0.000 | 0.000 | 0.001 | 0.030 | ||
| 7 spectra, ASLADIWAK | 0.000 | 0.000 | 0.033 | 0.966 | 0.000 | 0.001 | 0.000 | 0.000 | ||
| 4 spectra, LLVSGFWGVAR | 0.000 | 0.000 | 0.000 | 0.994 | 0.000 | 0.006 | 0.000 | 0.000 |
| Plot | Mito | Lyso or Perox | ER | Golgi | PM | Cytosol | Nucleus | ||||||
| Expt B |
8 peptides |
39 spectra |
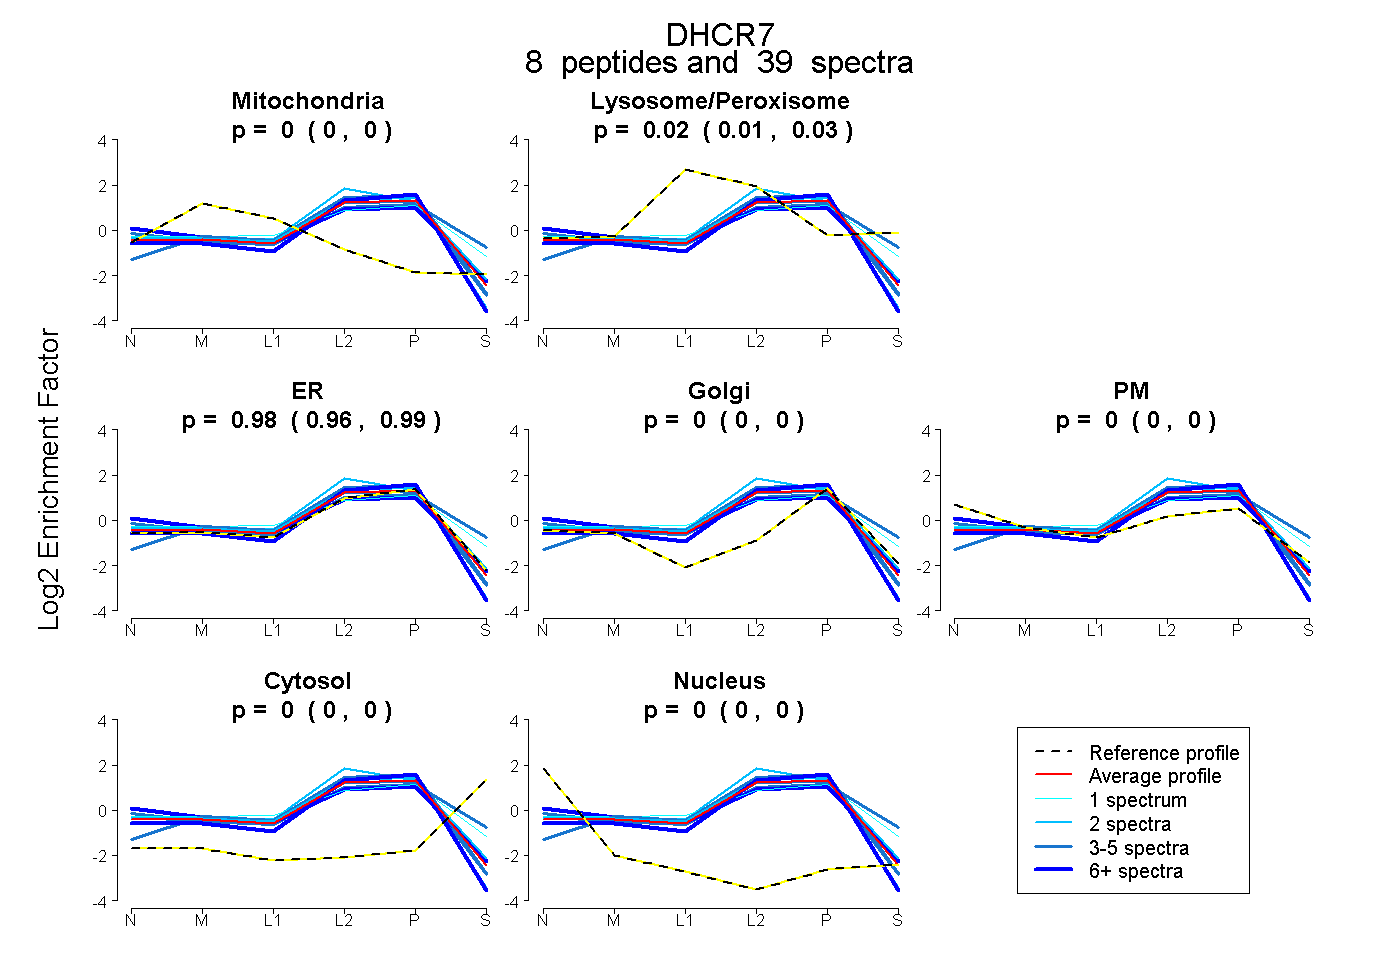 |
0.000 0.000 | 0.000 |
0.023 0.010 | 0.034 |
0.977 0.964 | 0.988 |
0.000 0.000 | 0.000 |
0.000 0.000 | 0.000 |
0.000 0.000 | 0.000 |
0.000 0.000 | 0.000 |
|||
| Plot | Lyso | Other | |||||||||||
| Expt C |
8 peptides |
109 spectra |
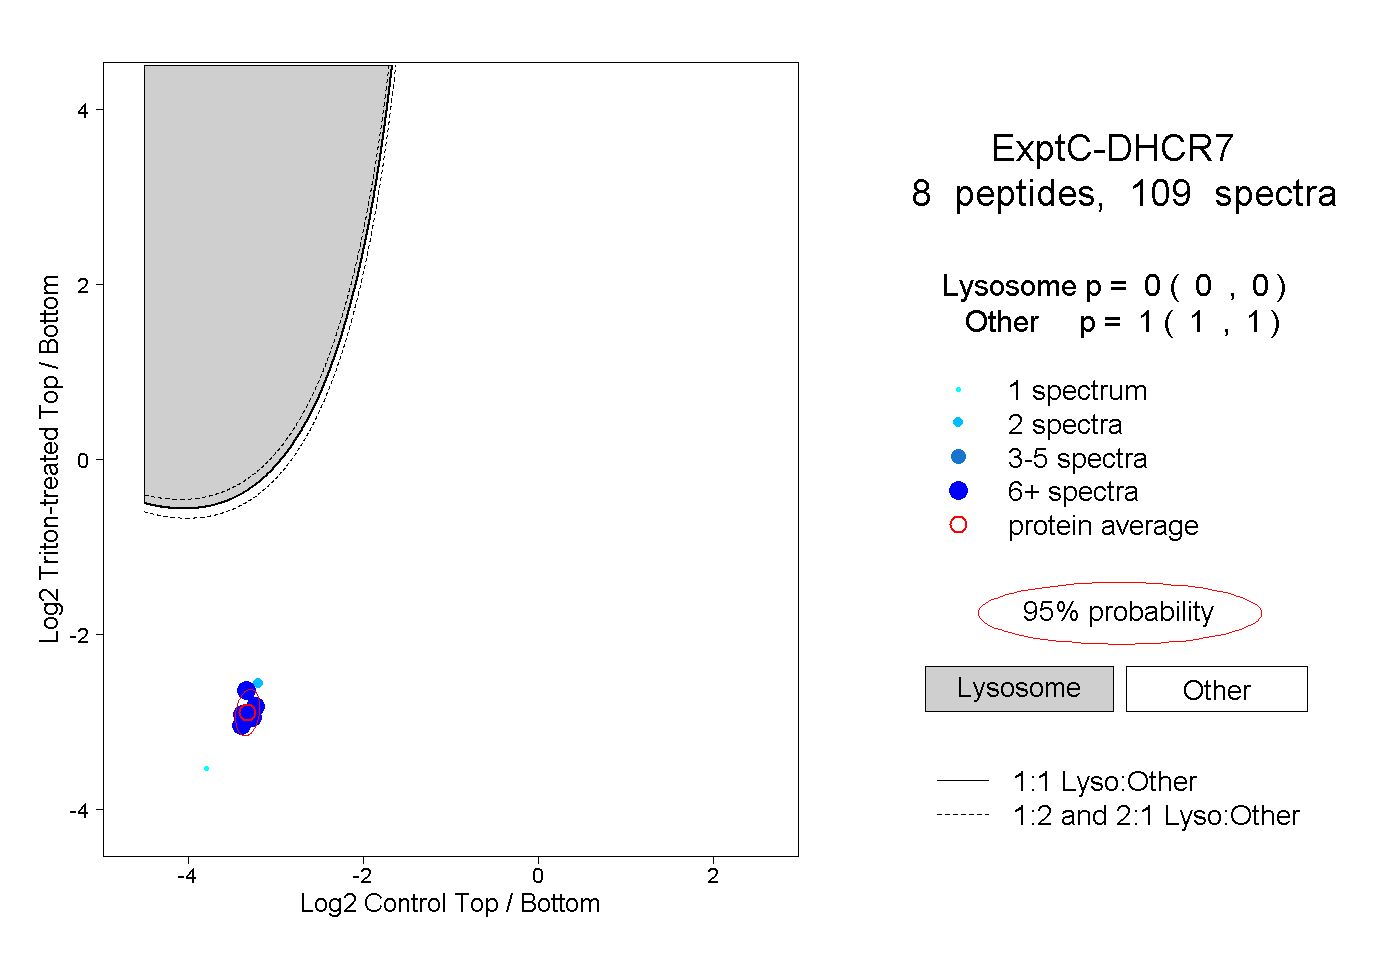 |
0.000 0.000 | 0.000 |
1.000 1.000 | 1.000 |
||||||||
| Plot | Lyso | Other | |||||||||||
| Expt D |
4 peptides |
9 spectra |
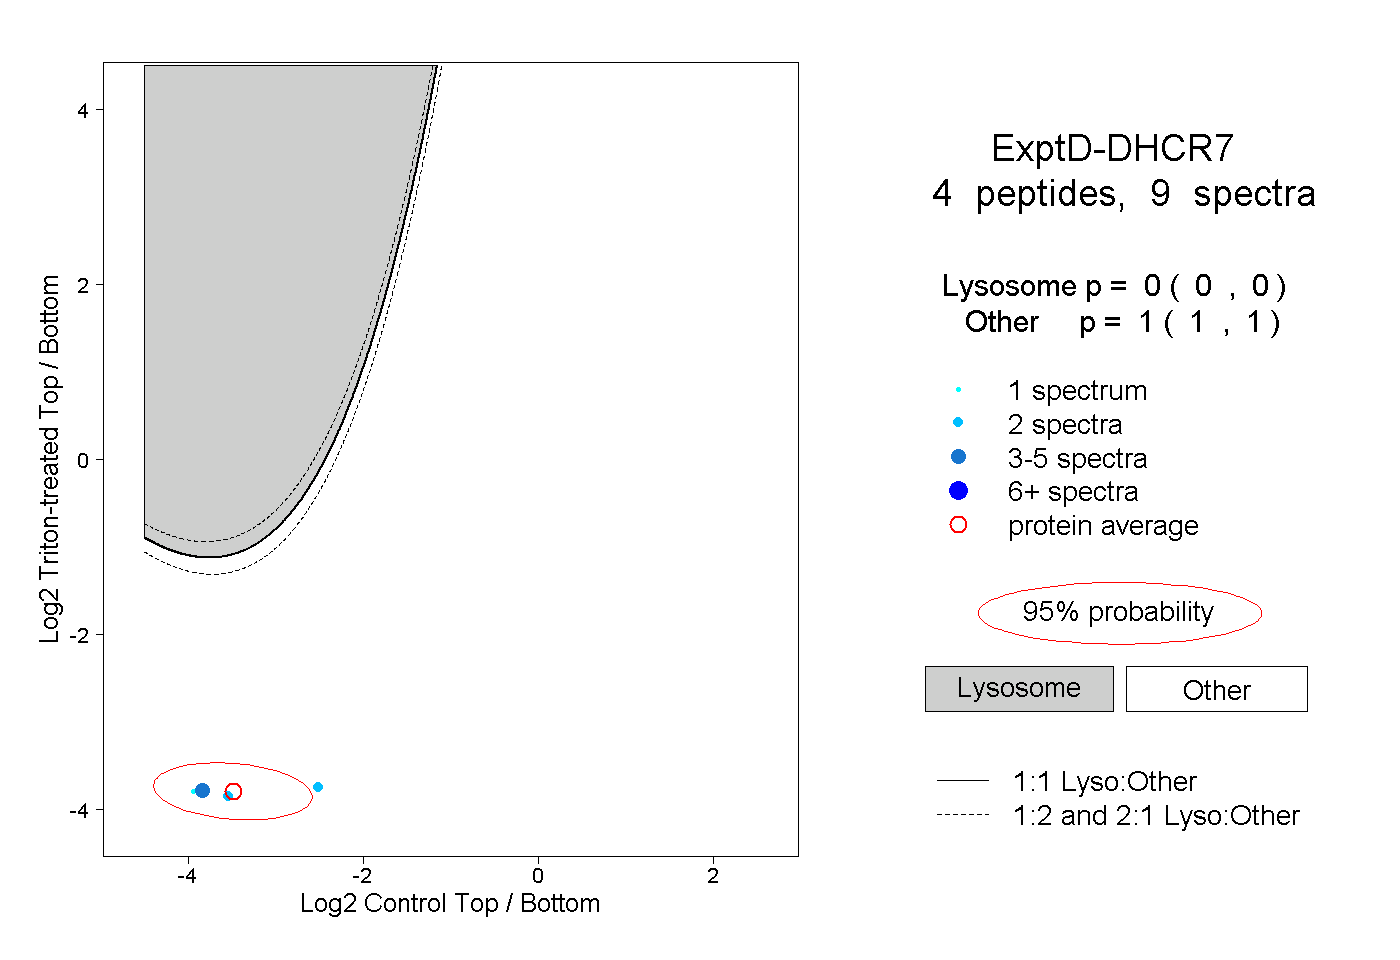 |
0.000 0.000 | 0.000 |
1.000 1.000 | 1.000 |