 13
13peptides
spectra
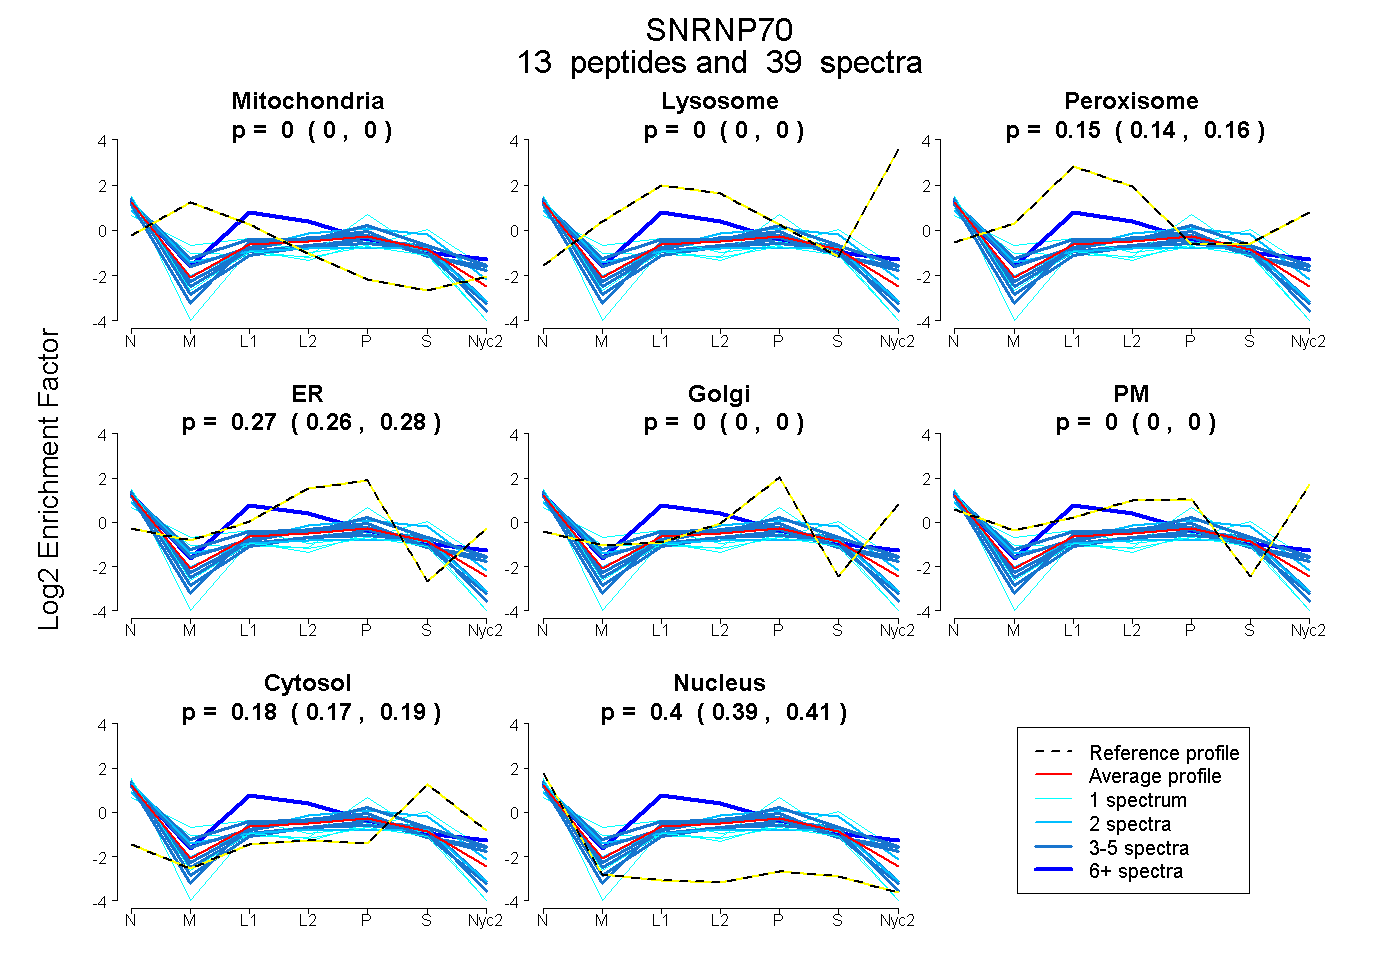
0.000 | 0.000
0.000 | 0.000
0.139 | 0.161
0.258 | 0.276
0.000 | 0.000
0.000 | 0.000
0.173 | 0.190
0.392 | 0.405
2peptides
spectra
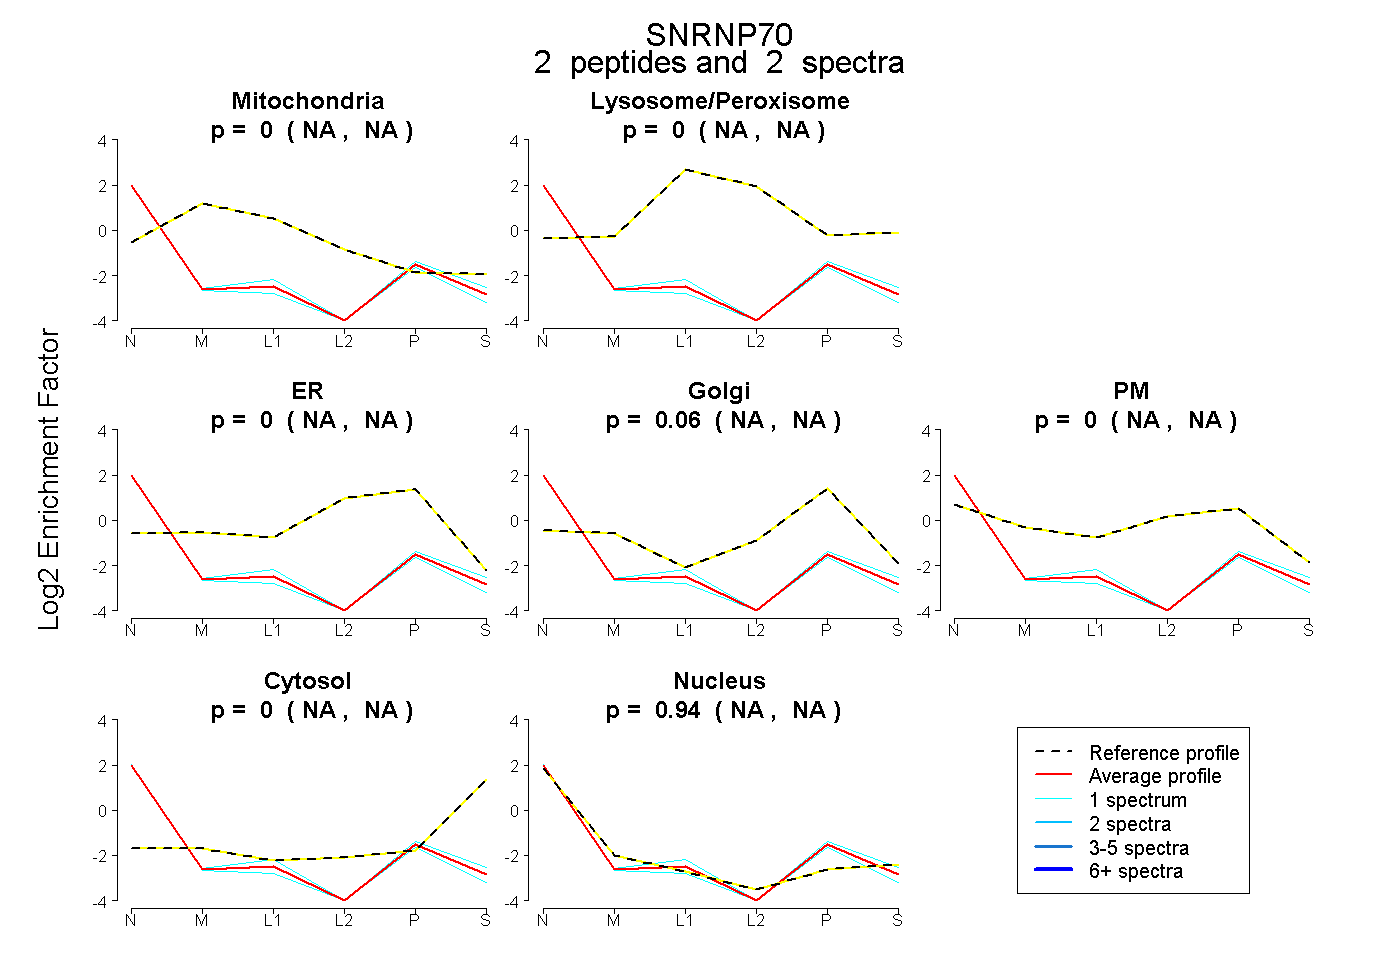
NA | NA
NA | NA
NA | NA
NA | NA
NA | NA
NA | NA
NA | NA
9peptides
spectra
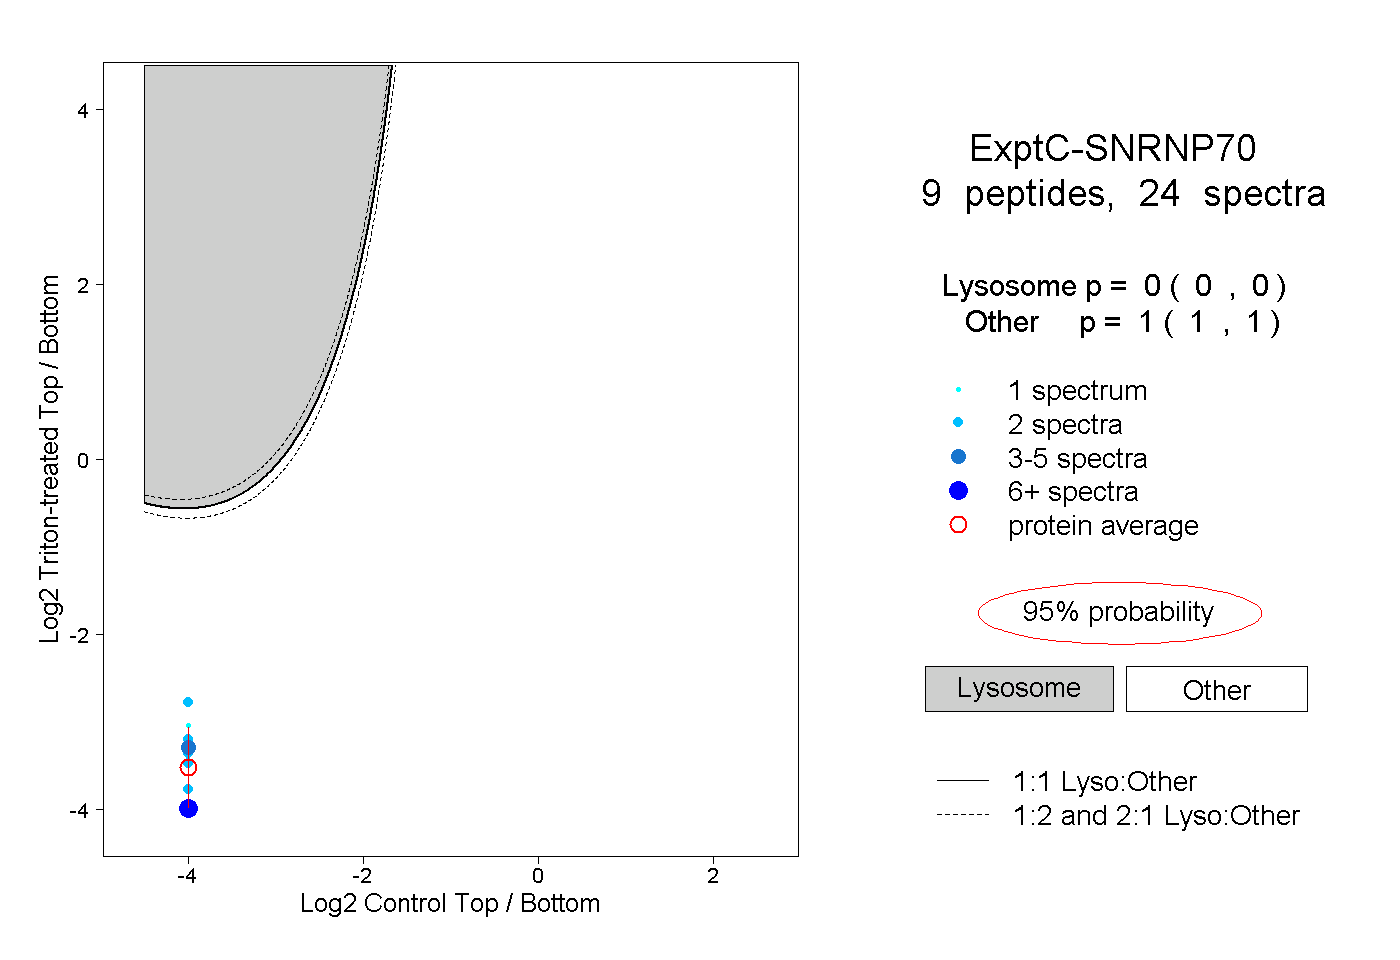
0.000 | 0.000
1.000 | 1.000
3peptides
spectra
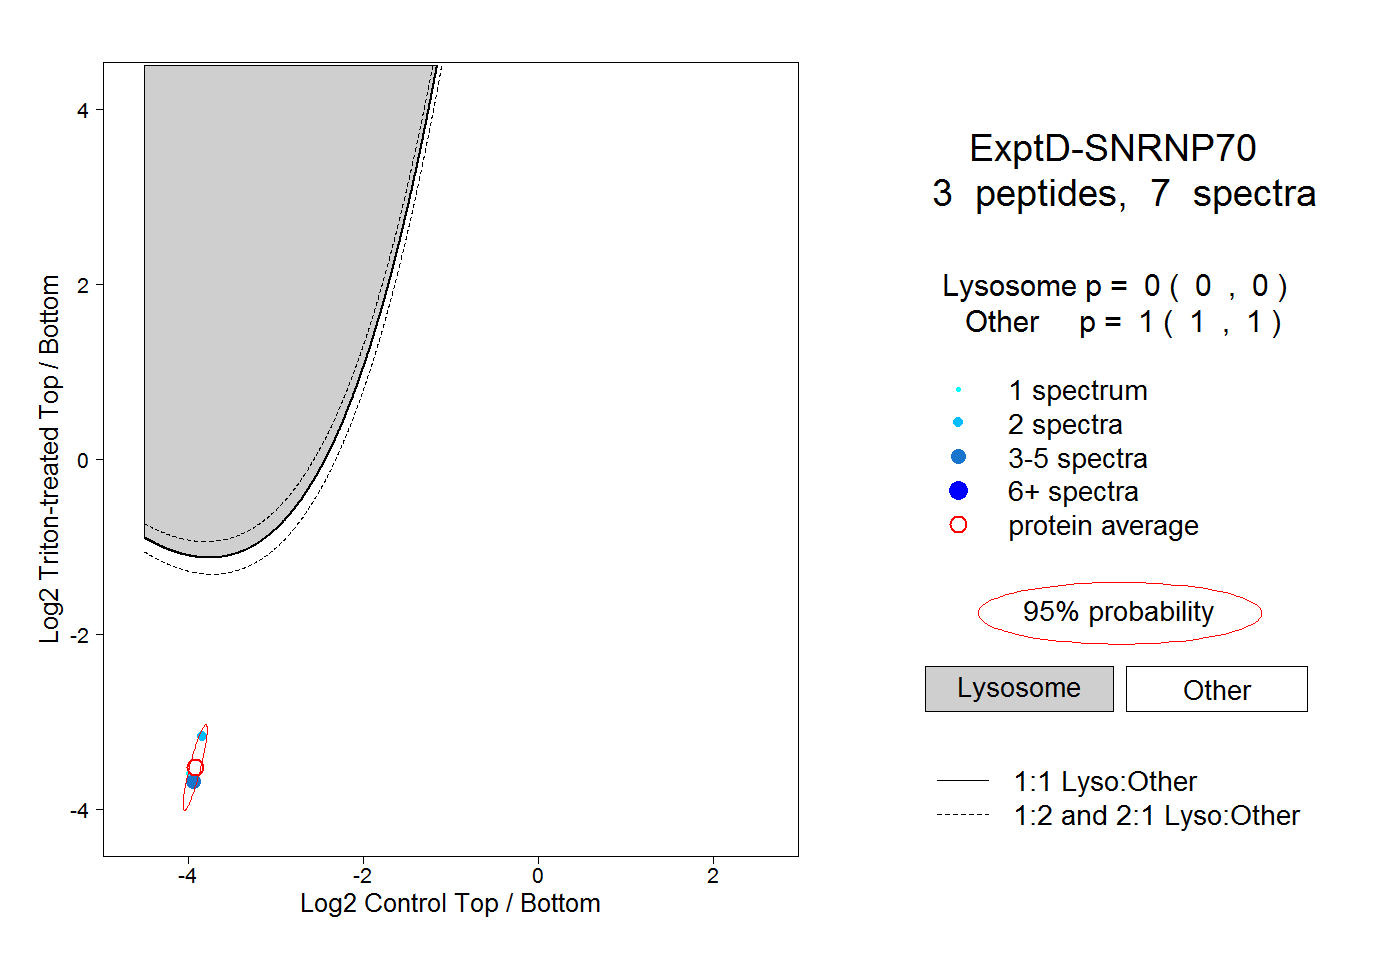
0.000 | 0.000
1.000 | 1.000