 13
13peptides
spectra
0.000 | 0.000
0.000 | 0.000
0.139 | 0.161
0.258 | 0.276
0.000 | 0.000
0.000 | 0.000
0.173 | 0.190
0.392 | 0.405
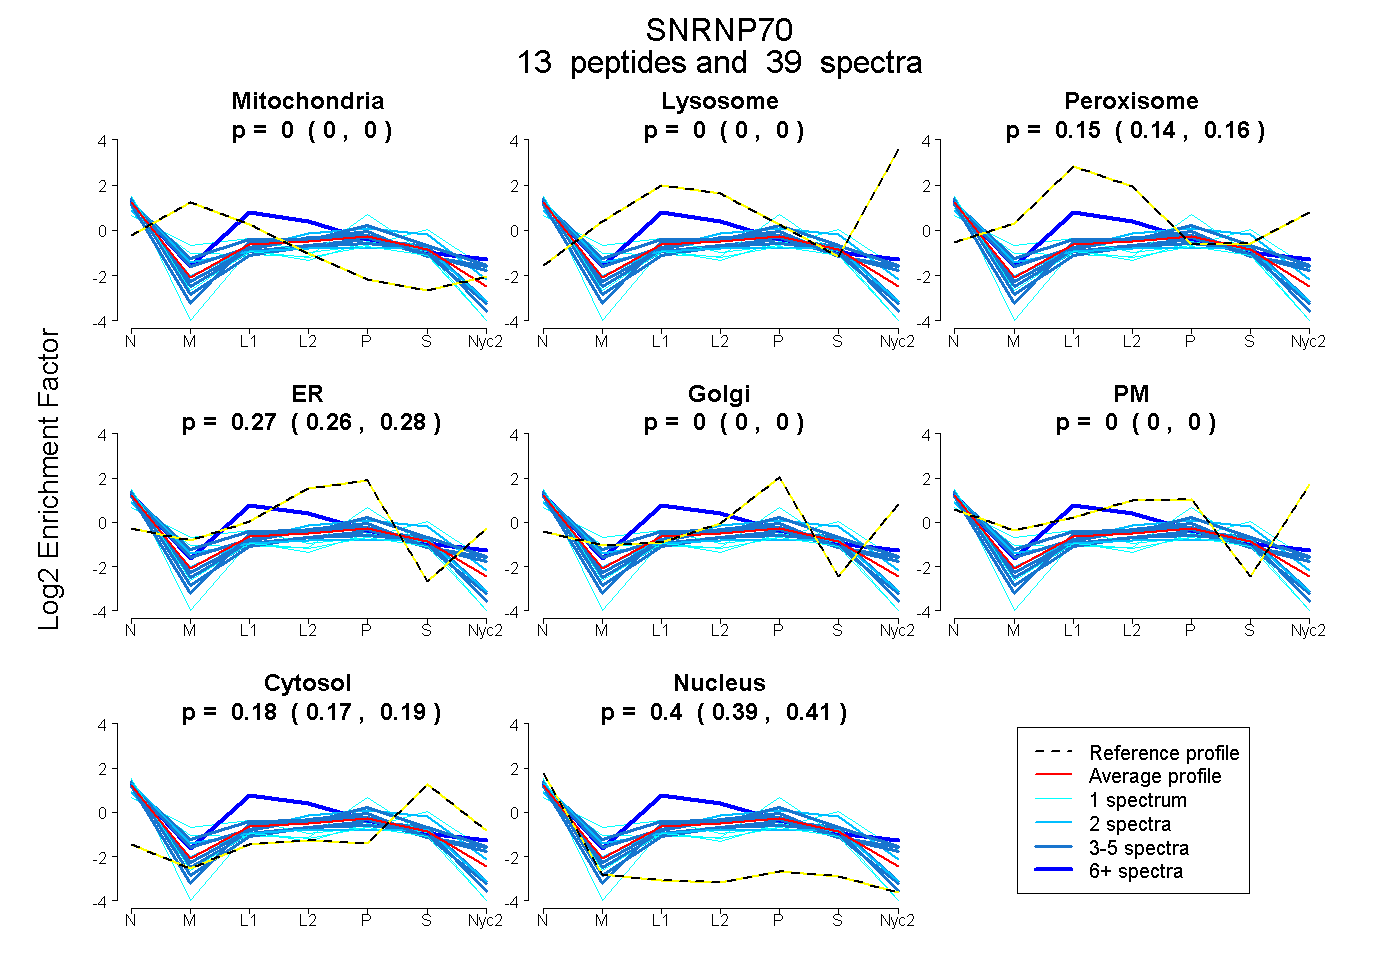
| Plot | Mito | Lyso | Perox | ER | Golgi | PM | Cytosol | Nucleus | |||||
| Expt A |
13 peptides |
39 spectra |
|
0.000 0.000 | 0.000 |
0.000 0.000 | 0.000 |
0.151 0.139 | 0.161 |
0.268 0.258 | 0.276 |
0.000 0.000 | 0.000 |
0.000 0.000 | 0.000 |
0.182 0.173 | 0.190 |
0.399 0.392 | 0.405 |
| 2 spectra, GYAFIEYEHER | 0.000 | 0.000 | 0.065 | 0.337 | 0.000 | 0.000 | 0.358 | 0.241 | ||
| 1 spectrum, VLVDVER | 0.000 | 0.000 | 0.090 | 0.181 | 0.000 | 0.000 | 0.130 | 0.599 | ||
| 1 spectrum, GGGGSGQDNGLEGLGSDGR | 0.000 | 0.000 | 0.000 | 0.189 | 0.000 | 0.000 | 0.240 | 0.571 | ||
| 7 spectra, GGADVNIR | 0.000 | 0.000 | 0.491 | 0.164 | 0.000 | 0.000 | 0.018 | 0.326 | ||
| 4 spectra, LGGGLGGTR | 0.000 | 0.000 | 0.091 | 0.324 | 0.000 | 0.000 | 0.123 | 0.462 | ||
| 3 spectra, DAPPPTR | 0.000 | 0.000 | 0.073 | 0.251 | 0.000 | 0.000 | 0.229 | 0.447 | ||
| 5 spectra, IHMVYSK | 0.000 | 0.000 | 0.287 | 0.249 | 0.000 | 0.000 | 0.070 | 0.394 | ||
| 2 spectra, MWDPHNDPNAQGDAFK | 0.000 | 0.000 | 0.227 | 0.134 | 0.000 | 0.000 | 0.128 | 0.511 | ||
| 1 spectrum, EFEVYGPIK | 0.120 | 0.000 | 0.266 | 0.052 | 0.000 | 0.000 | 0.329 | 0.234 | ||
| 4 spectra, TLFVAR | 0.000 | 0.000 | 0.148 | 0.350 | 0.000 | 0.014 | 0.143 | 0.345 | ||
| 1 spectrum, DMHSAYK | 0.078 | 0.000 | 0.000 | 0.393 | 0.000 | 0.000 | 0.102 | 0.426 | ||
| 4 spectra, HADGK | 0.000 | 0.000 | 0.043 | 0.238 | 0.000 | 0.000 | 0.213 | 0.506 | ||
| 4 spectra, VNYDTTESK | 0.000 | 0.000 | 0.009 | 0.394 | 0.000 | 0.000 | 0.341 | 0.256 |
| Plot | Mito | Lyso or Perox | ER | Golgi | PM | Cytosol | Nucleus | ||||||
| Expt B |
2 peptides |
2 spectra |
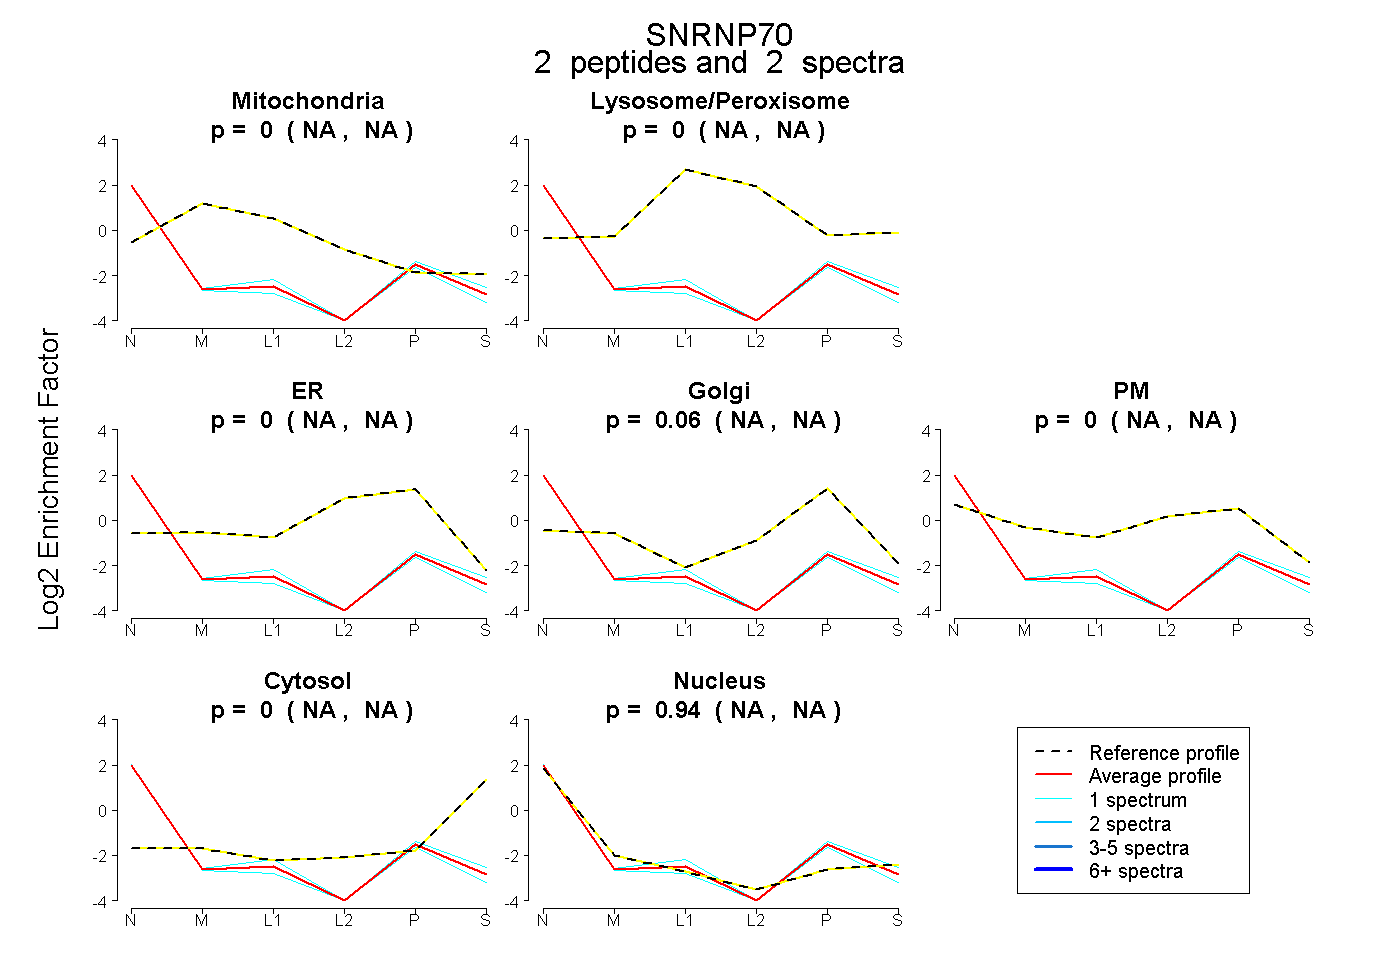 |
0.000 NA | NA |
0.000 NA | NA |
0.000 NA | NA |
0.059 NA | NA |
0.000 NA | NA |
0.000 NA | NA |
0.941 NA | NA |
|||
| Plot | Lyso | Other | |||||||||||
| Expt C |
9 peptides |
24 spectra |
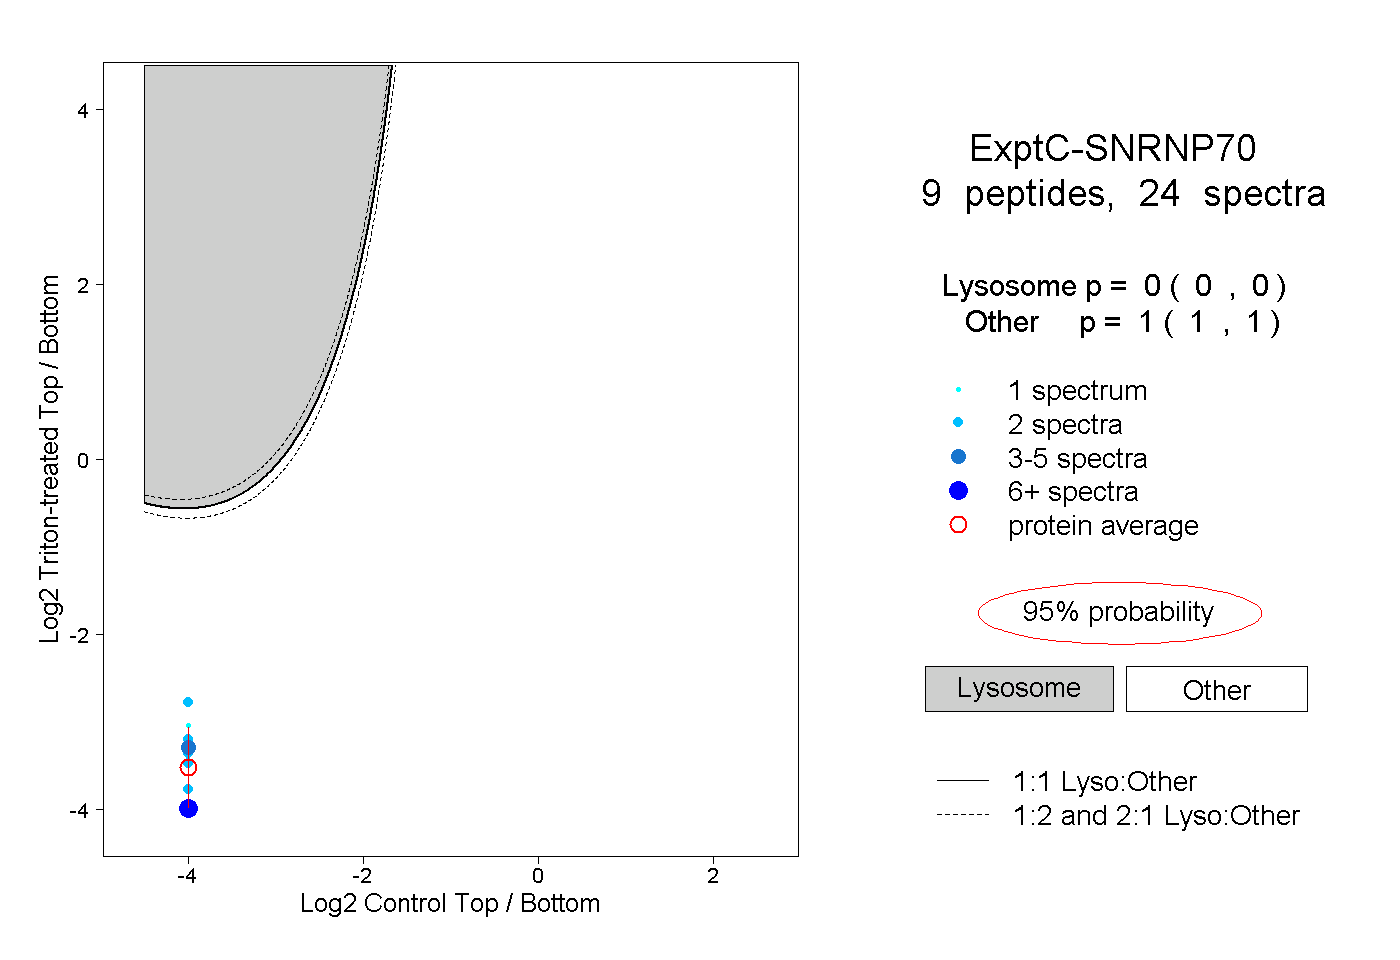 |
0.000 0.000 | 0.000 |
1.000 1.000 | 1.000 |
||||||||
| Plot | Lyso | Other | |||||||||||
| Expt D |
3 peptides |
7 spectra |
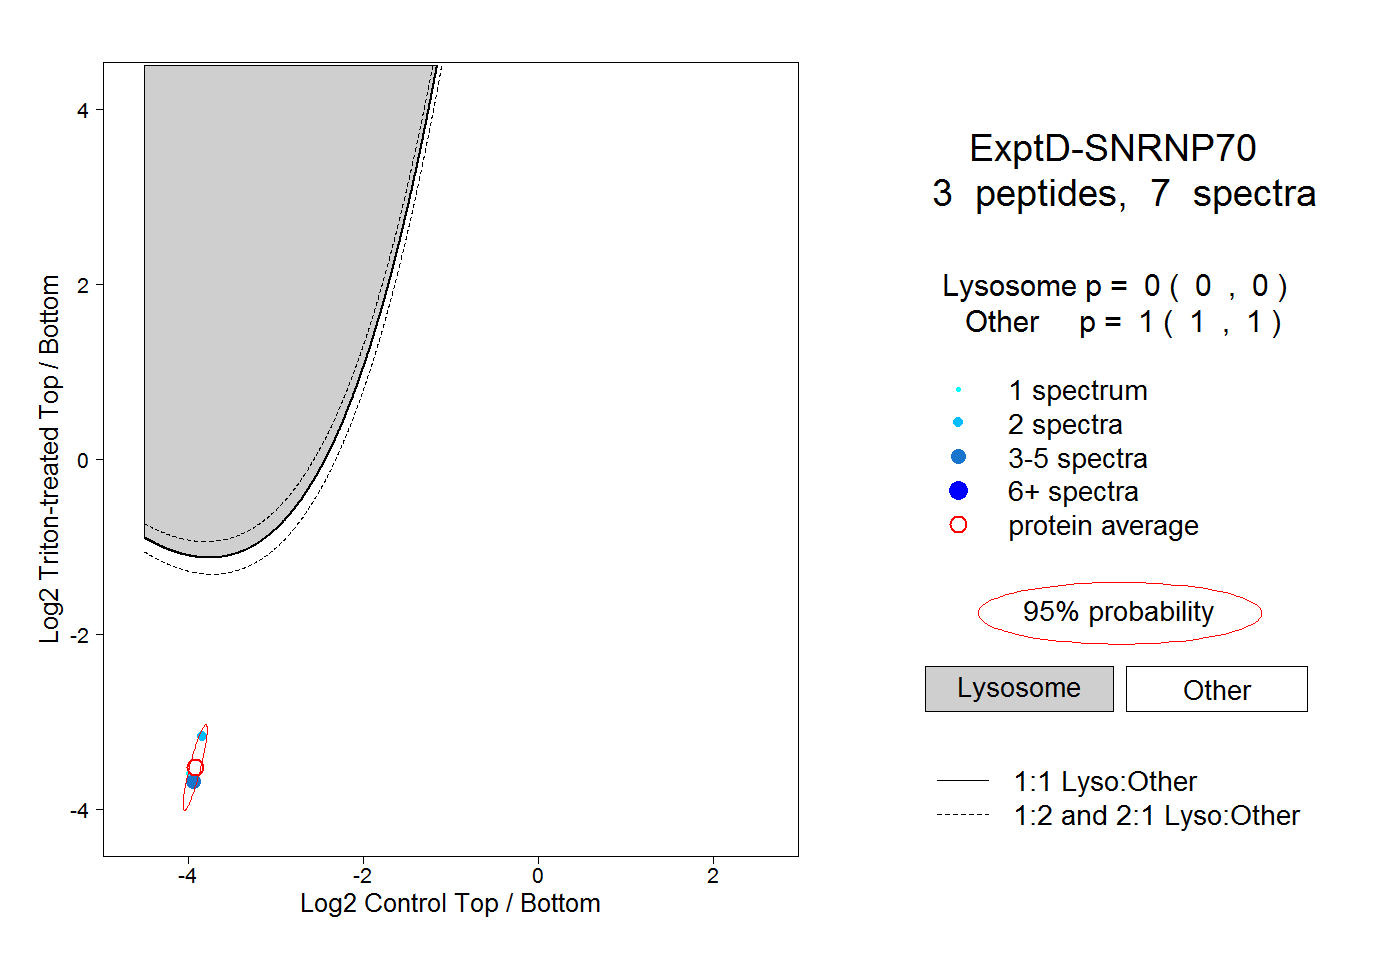 |
0.000 0.000 | 0.000 |
1.000 1.000 | 1.000 |