 12
12peptides
spectra
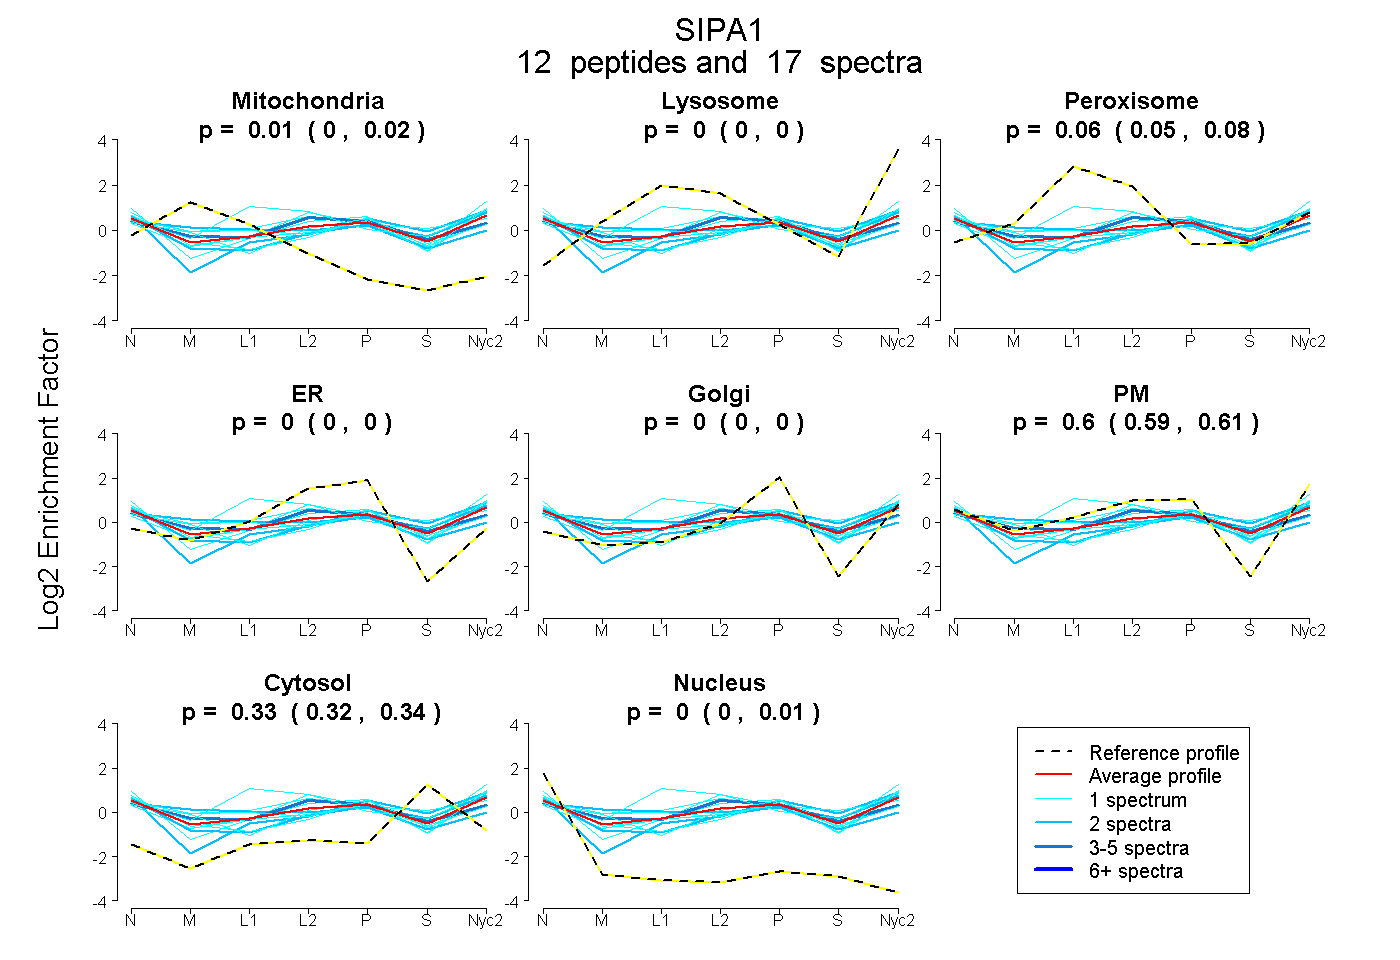
0.000 | 0.016
0.000 | 0.000
0.047 | 0.082
0.000 | 0.000
0.000 | 0.000
0.587 | 0.612
0.316 | 0.336
0.000 | 0.006
2peptides
spectra
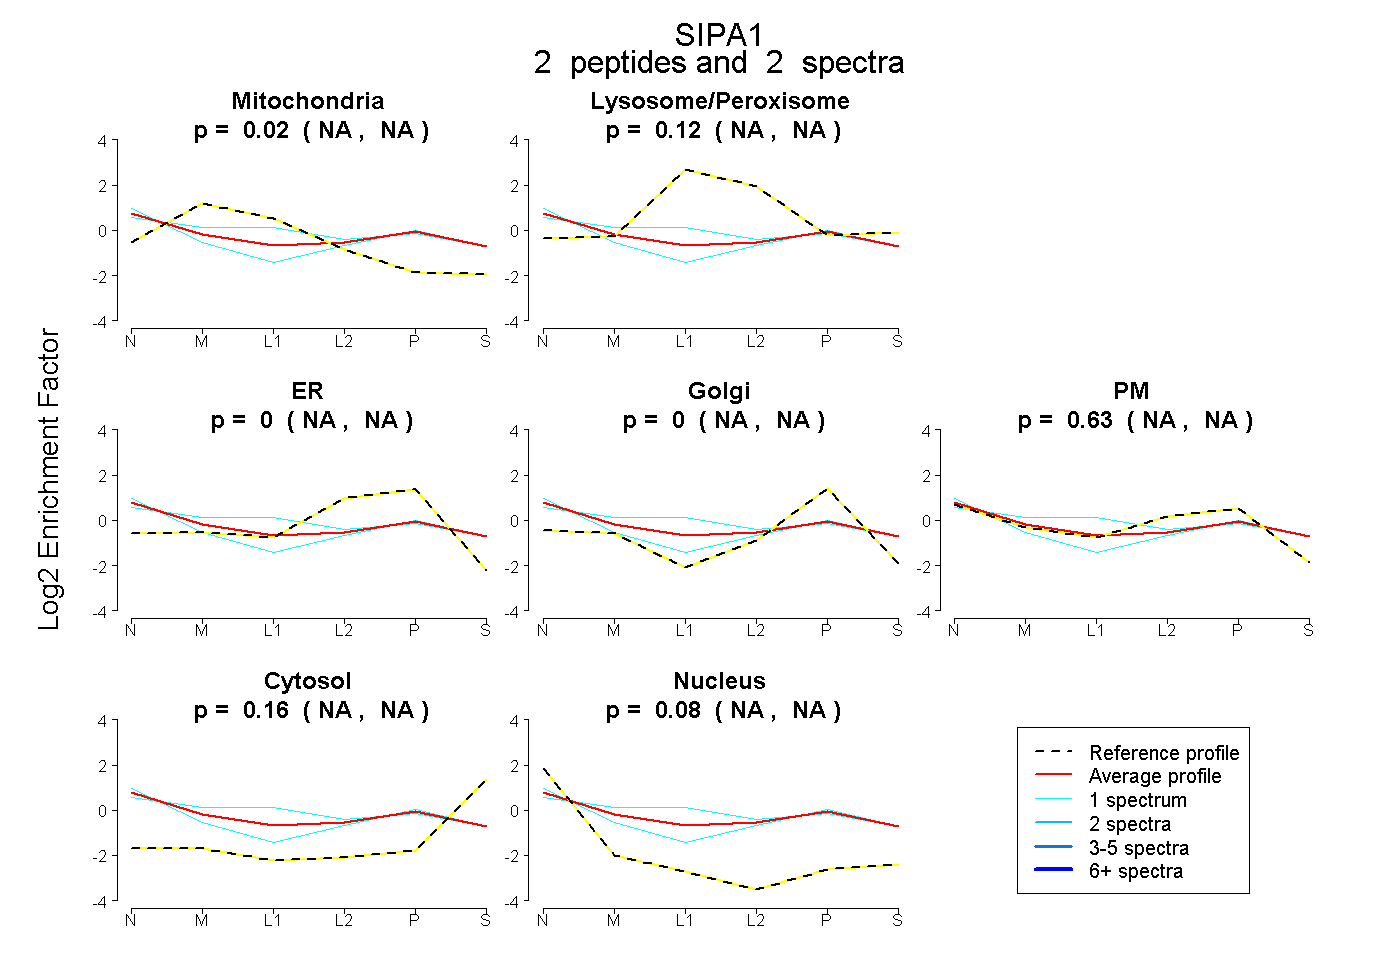
NA | NA
NA | NA
NA | NA
NA | NA
NA | NA
NA | NA
NA | NA
6peptides
spectra
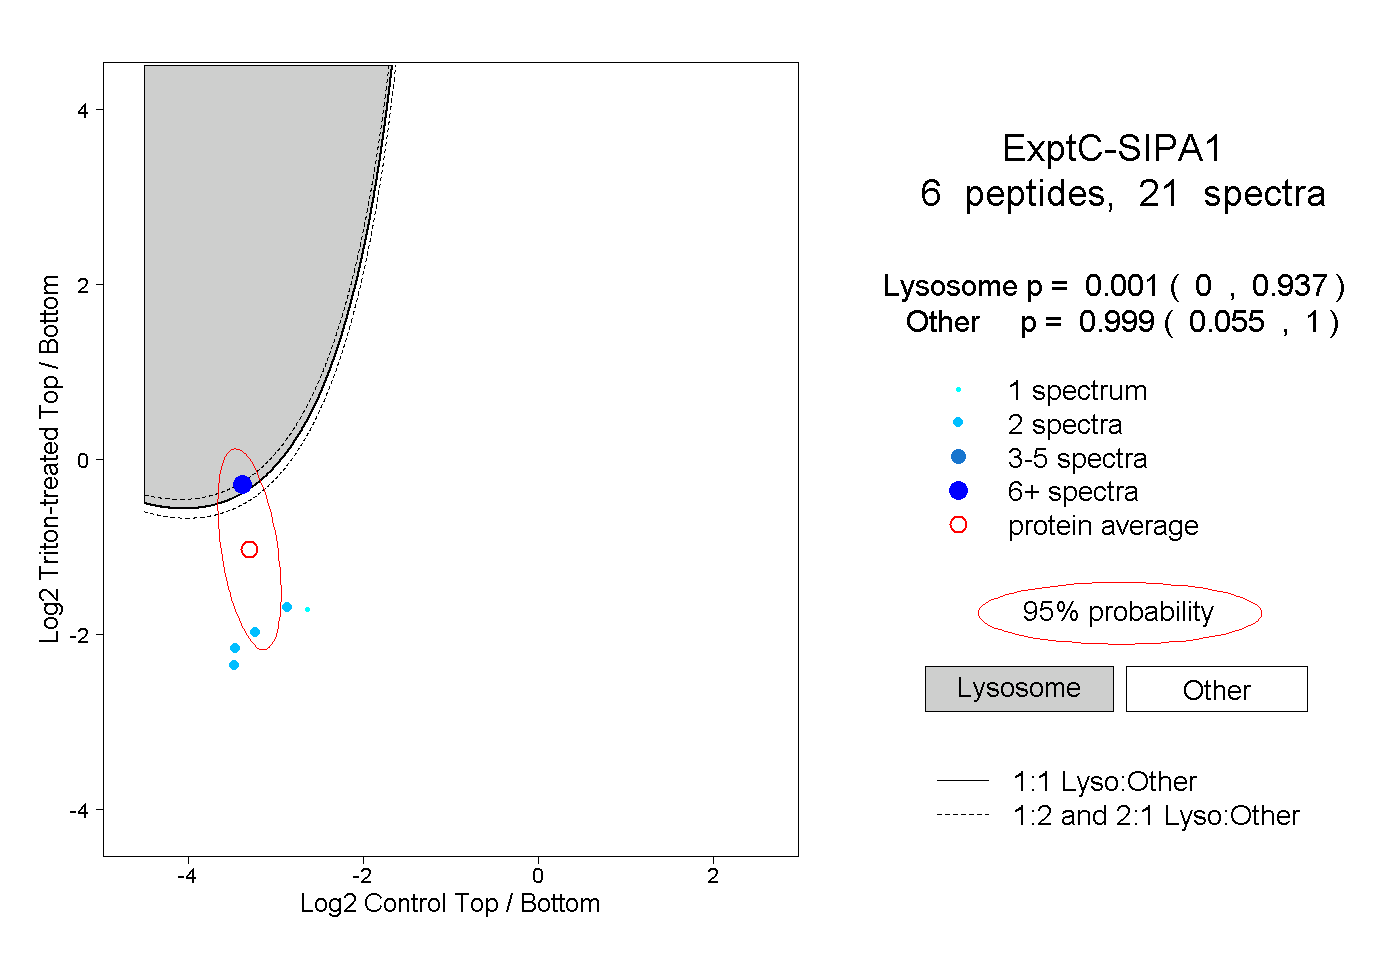
0.000 | 0.937
0.055 | 1.000
1peptide
spectra
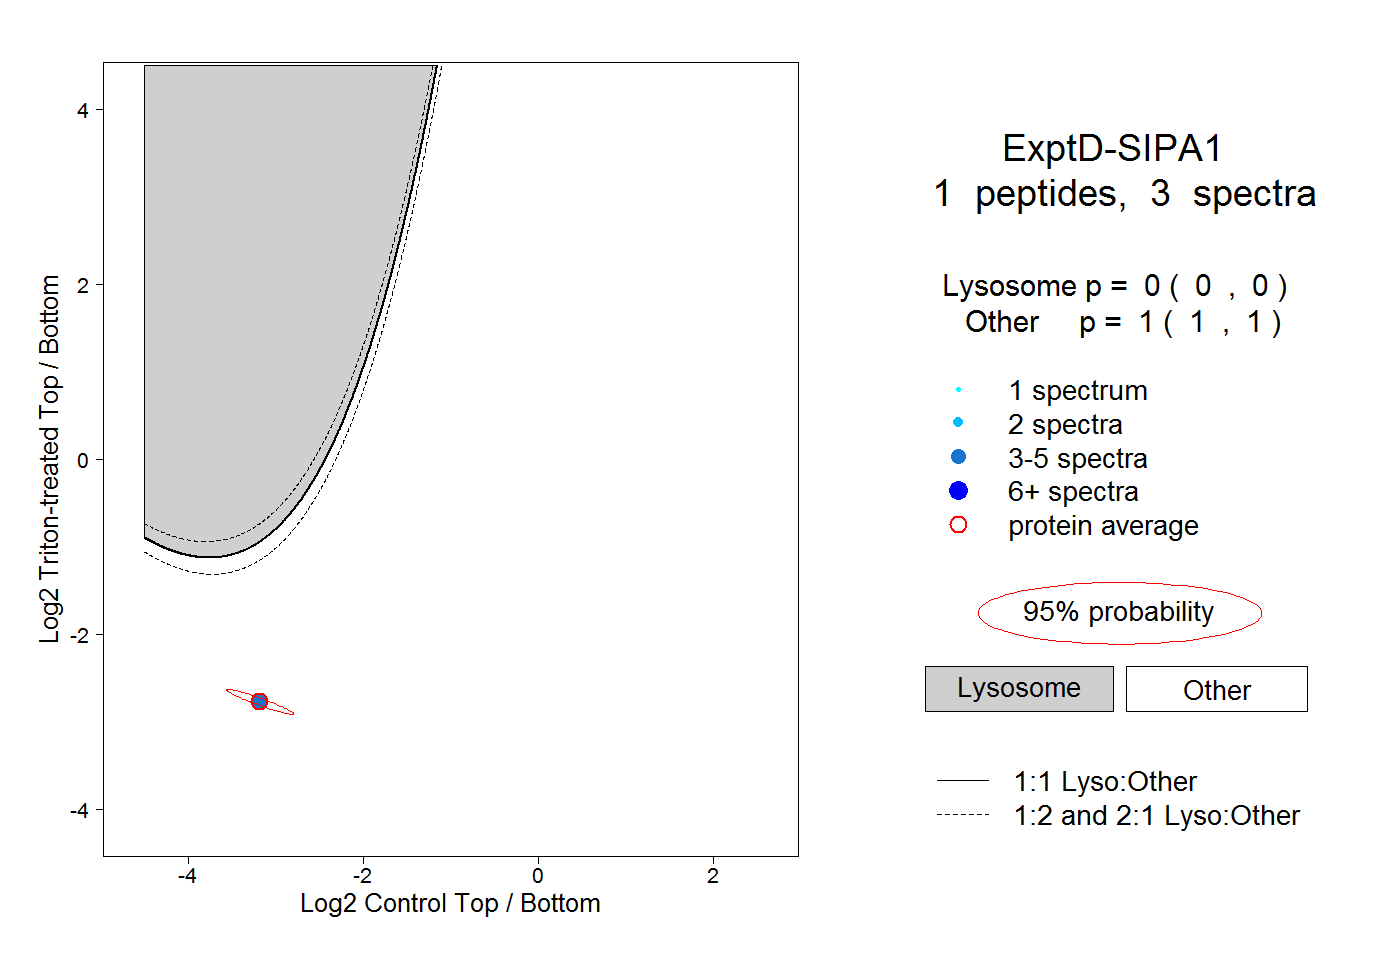
0.000 | 0.000
1.000 | 1.000