 12
12peptides
spectra
0.000 | 0.016
0.000 | 0.000
0.047 | 0.082
0.000 | 0.000
0.000 | 0.000
0.587 | 0.612
0.316 | 0.336
0.000 | 0.006
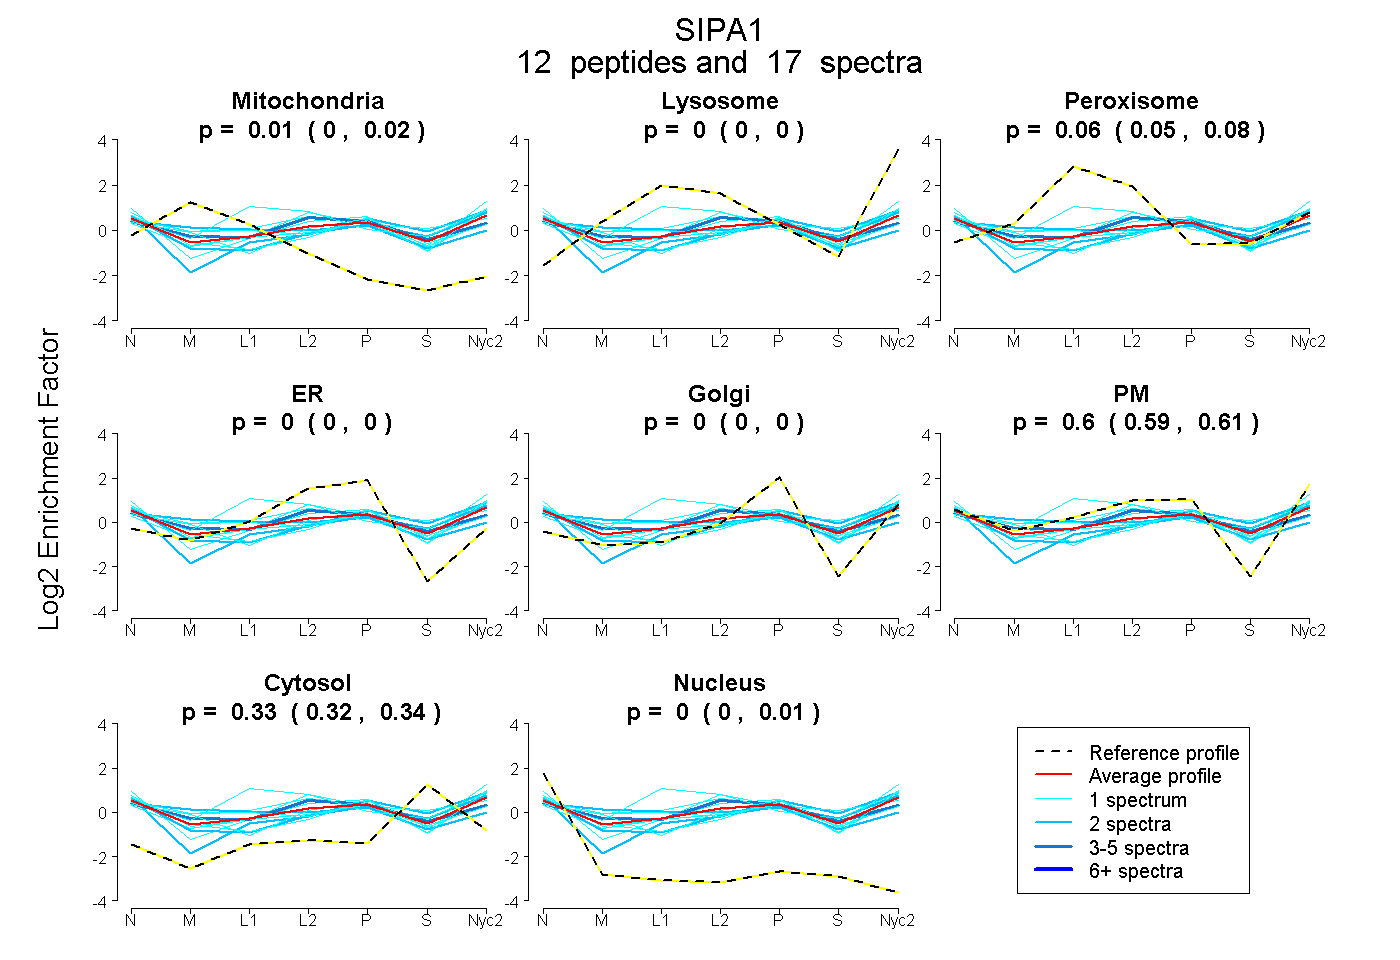
| Plot | Mito | Lyso | Perox | ER | Golgi | PM | Cytosol | Nucleus | |||||
| Expt A |
12 peptides |
17 spectra |
|
0.006 0.000 | 0.016 |
0.000 0.000 | 0.000 |
0.064 0.047 | 0.082 |
0.000 0.000 | 0.000 |
0.000 0.000 | 0.000 |
0.601 0.587 | 0.612 |
0.328 0.316 | 0.336 |
0.000 0.000 | 0.006 |
| 2 spectra, LGFEVDAEGFITHVER | 0.203 | 0.000 | 0.131 | 0.000 | 0.063 | 0.392 | 0.210 | 0.000 | ||
| 1 spectrum, AHSHEDTSRPAATPTR | 0.024 | 0.000 | 0.183 | 0.000 | 0.000 | 0.594 | 0.199 | 0.000 | ||
| 1 spectrum, SGSDAGEVRPPTPASPR | 0.088 | 0.014 | 0.037 | 0.000 | 0.000 | 0.634 | 0.226 | 0.000 | ||
| 1 spectrum, DGGSPPGPGDLTEER | 0.000 | 0.000 | 0.174 | 0.000 | 0.000 | 0.459 | 0.367 | 0.000 | ||
| 1 spectrum, FGLPSLGGR | 0.000 | 0.000 | 0.000 | 0.000 | 0.000 | 0.713 | 0.257 | 0.030 | ||
| 2 spectra, AALEEEVR | 0.000 | 0.000 | 0.000 | 0.000 | 0.000 | 0.551 | 0.449 | 0.000 | ||
| 1 spectrum, LSPTCLR | 0.012 | 0.000 | 0.000 | 0.000 | 0.092 | 0.540 | 0.295 | 0.061 | ||
| 1 spectrum, TLLTLDEQVLSFQR | 0.000 | 0.000 | 0.000 | 0.000 | 0.000 | 0.697 | 0.303 | 0.000 | ||
| 1 spectrum, VCVTVLPPDESGRPR | 0.096 | 0.000 | 0.000 | 0.000 | 0.136 | 0.466 | 0.302 | 0.000 | ||
| 1 spectrum, SHFQHVFLVVR | 0.000 | 0.000 | 0.441 | 0.000 | 0.000 | 0.362 | 0.198 | 0.000 | ||
| 2 spectra, FTFAETTGLRPGAR | 0.000 | 0.000 | 0.000 | 0.000 | 0.000 | 0.587 | 0.403 | 0.010 | ||
| 3 spectra, QFHAMATR | 0.032 | 0.000 | 0.124 | 0.063 | 0.000 | 0.476 | 0.305 | 0.000 |
| Plot | Mito | Lyso or Perox | ER | Golgi | PM | Cytosol | Nucleus | ||||||
| Expt B |
2 peptides |
2 spectra |
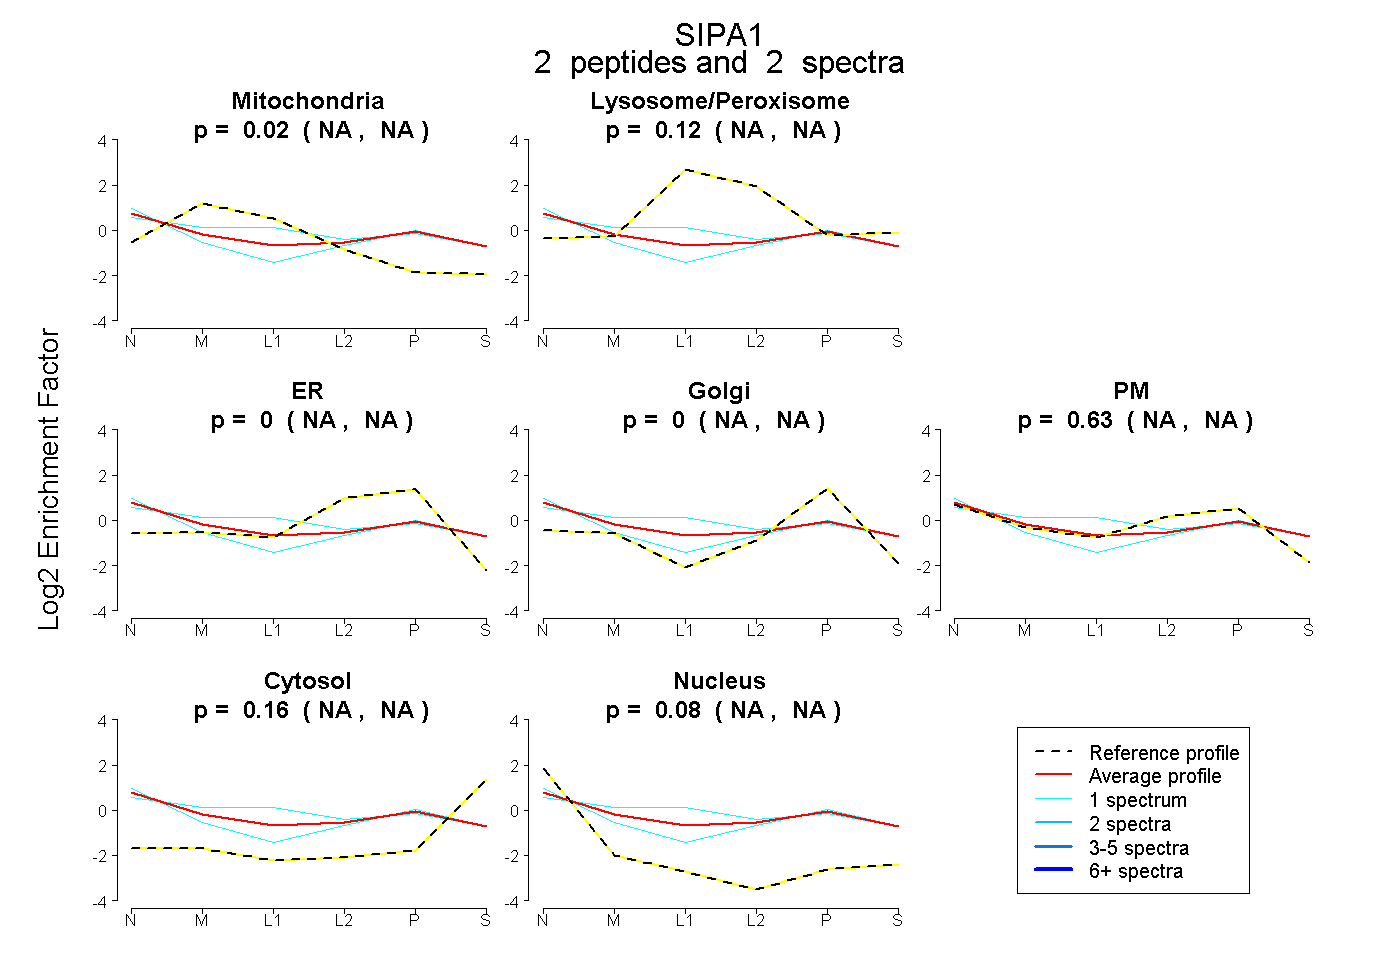 |
0.016 NA | NA |
0.121 NA | NA |
0.000 NA | NA |
0.000 NA | NA |
0.630 NA | NA |
0.155 NA | NA |
0.078 NA | NA |
|||
| Plot | Lyso | Other | |||||||||||
| Expt C |
6 peptides |
21 spectra |
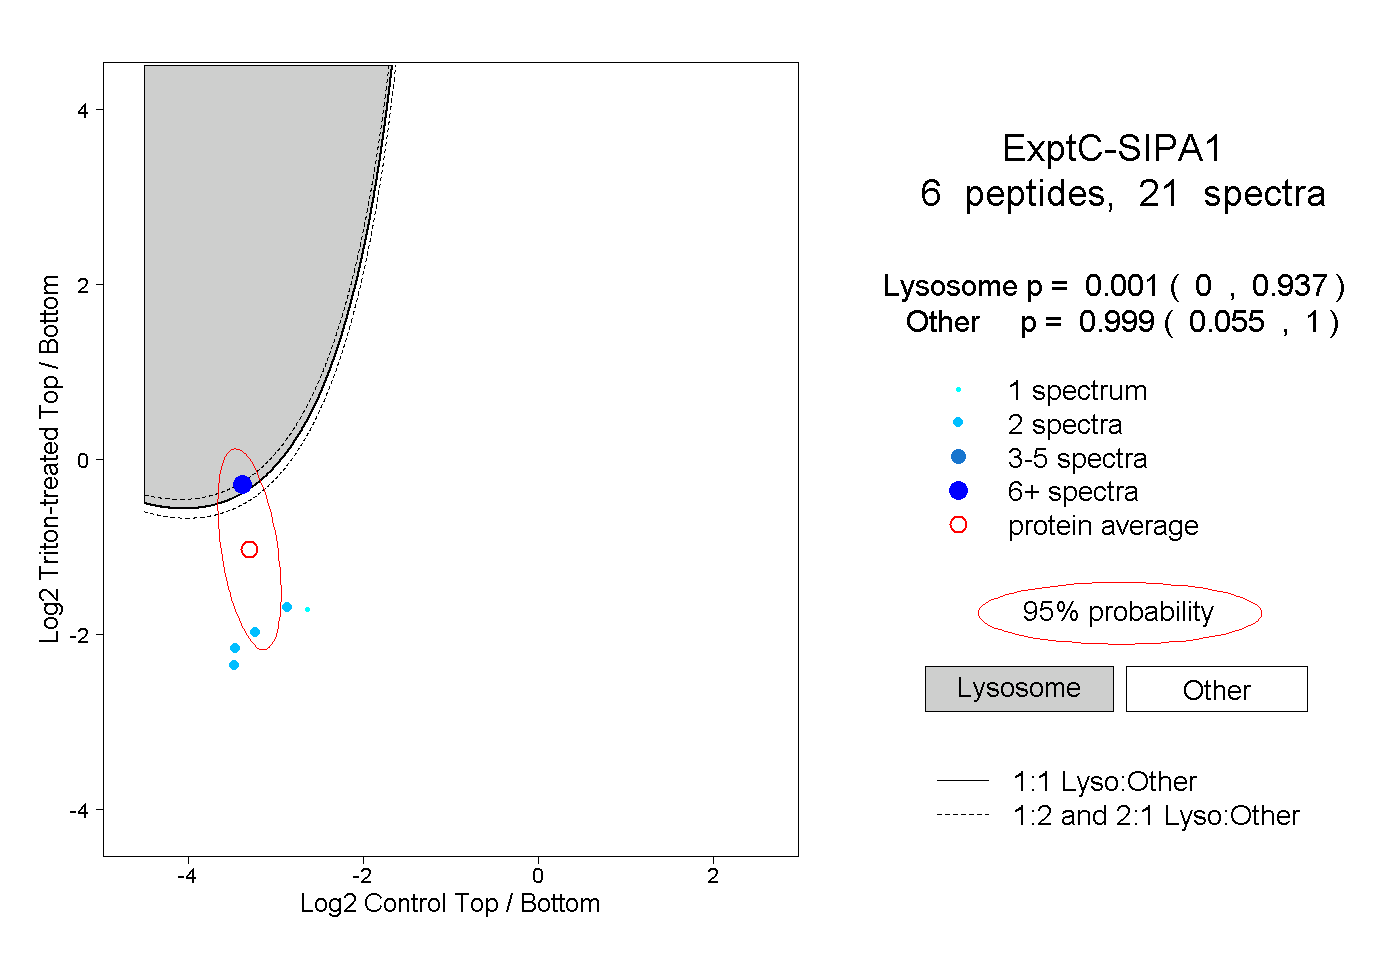 |
0.001 0.000 | 0.937 |
0.999 0.055 | 1.000 |
||||||||
| Plot | Lyso | Other | |||||||||||
| Expt D |
1 peptide |
3 spectra |
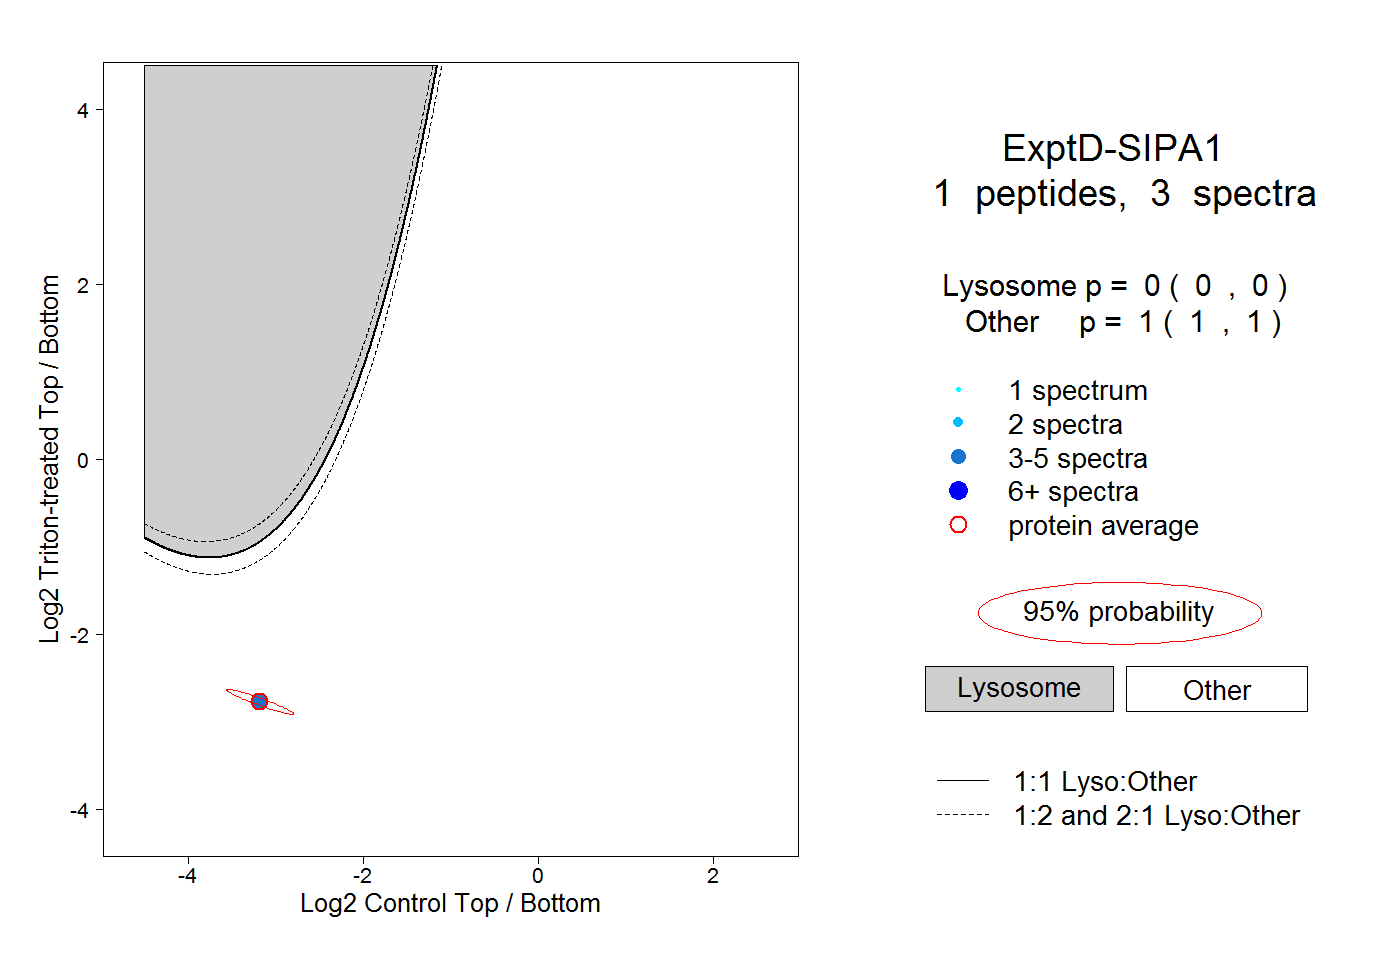 |
0.000 0.000 | 0.000 |
1.000 1.000 | 1.000 |