 3
3peptides
spectra
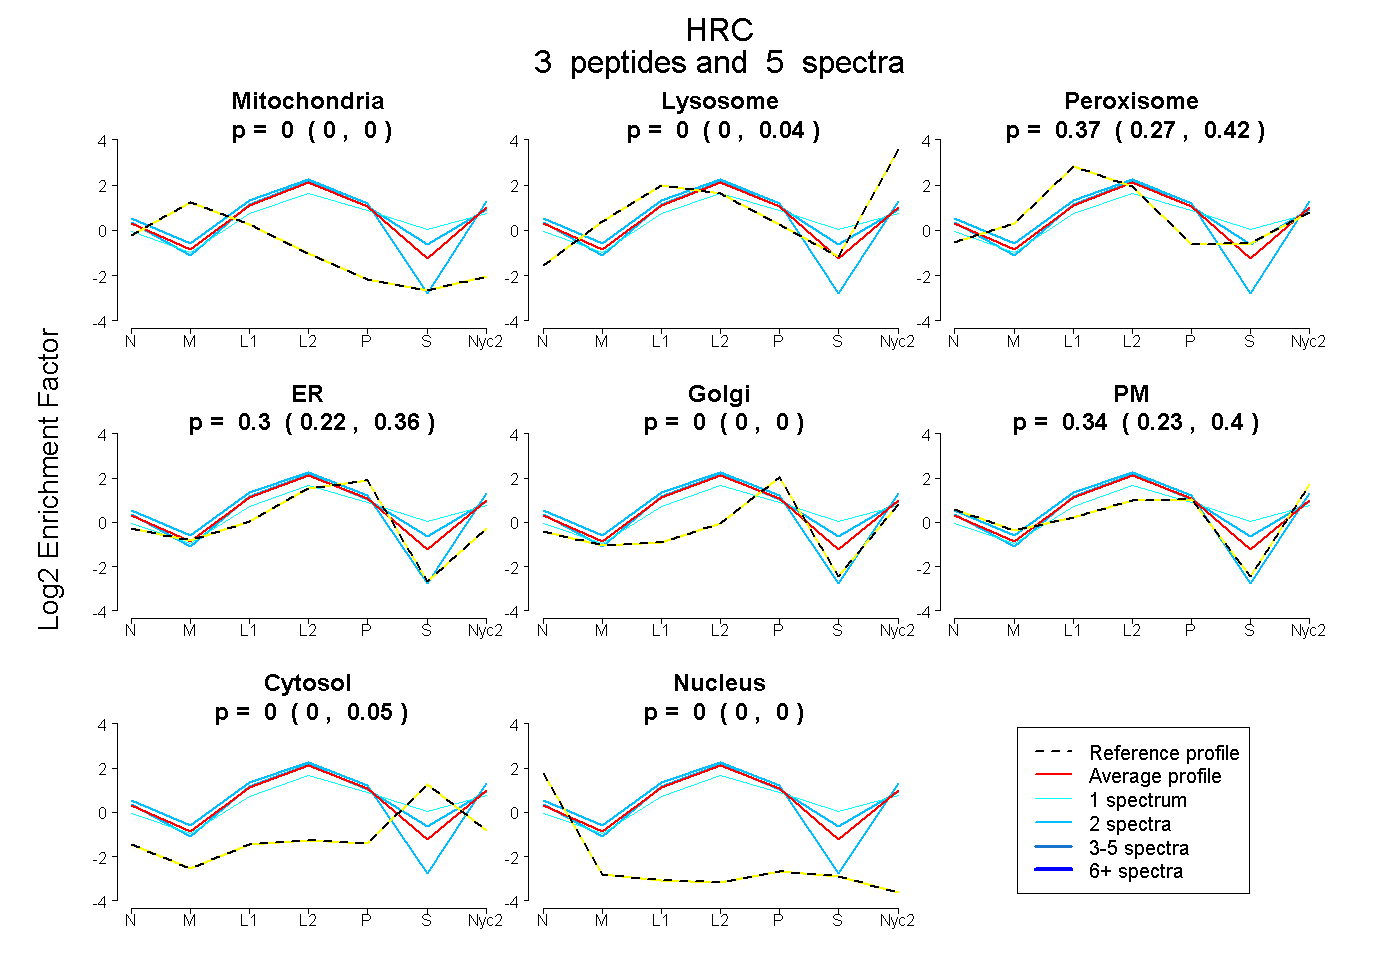
0.000 | 0.000
0.000 | 0.042
0.268 | 0.416
0.219 | 0.356
0.000 | 0.000
0.228 | 0.400
0.000 | 0.049
0.000 | 0.000
1peptide
spectrum
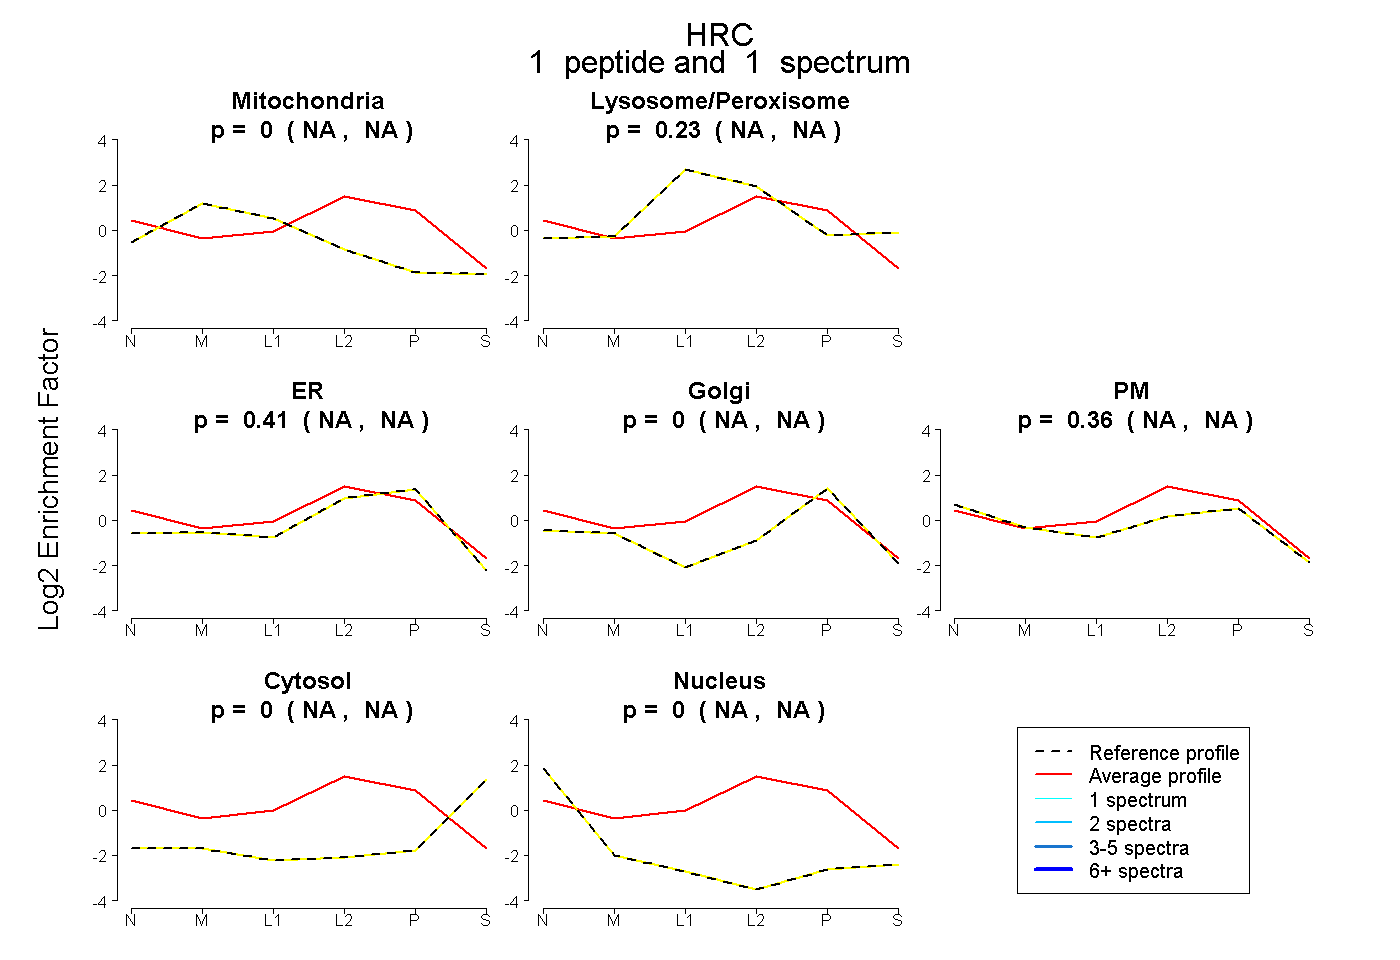
NA | NA
NA | NA
NA | NA
NA | NA
NA | NA
NA | NA
NA | NA
2peptides
spectra
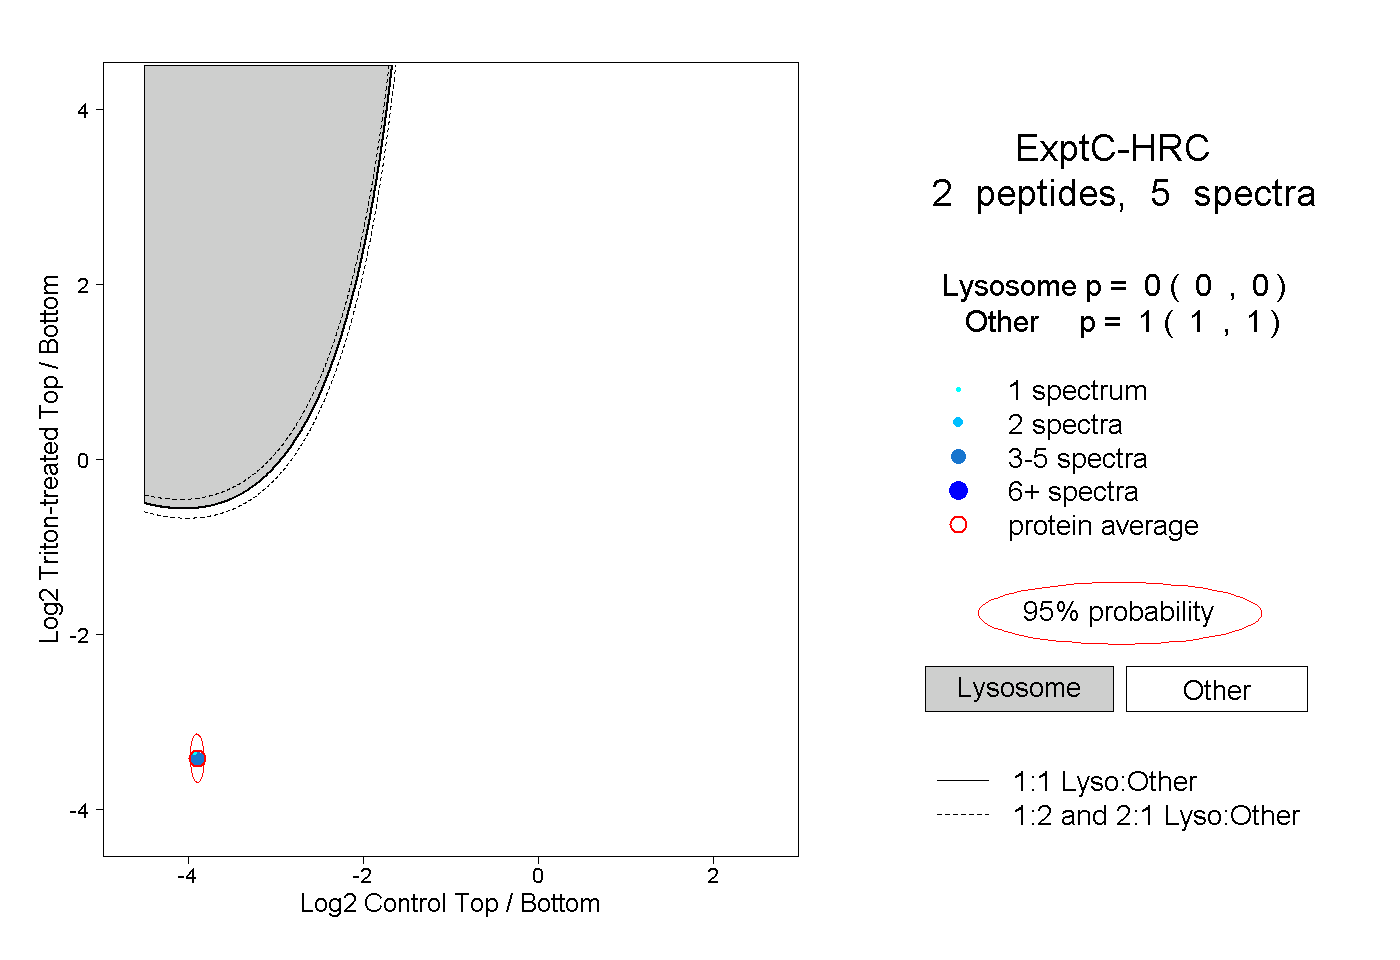
0.000 | 0.000
1.000 | 1.000