 3
3peptides
spectra
0.000 | 0.000
0.000 | 0.042
0.268 | 0.416
0.219 | 0.356
0.000 | 0.000
0.228 | 0.400
0.000 | 0.049
0.000 | 0.000
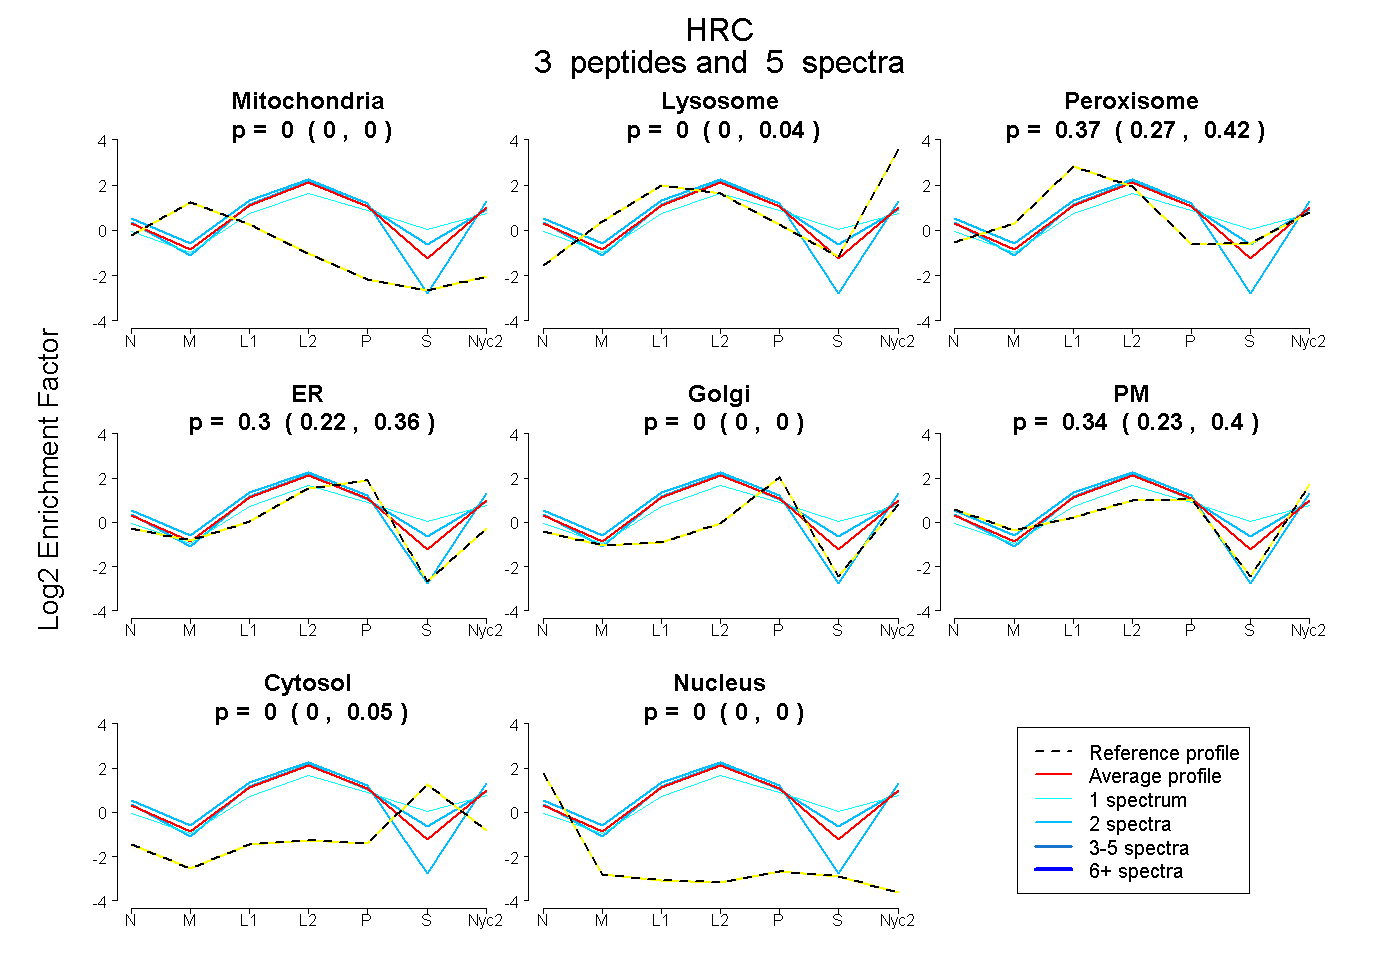
| Plot | Mito | Lyso | Perox | ER | Golgi | PM | Cytosol | Nucleus | |||||
| Expt A |
3 peptides |
5 spectra |
|
0.000 0.000 | 0.000 |
0.000 0.000 | 0.042 |
0.366 0.268 | 0.416 |
0.299 0.219 | 0.356 |
0.000 0.000 | 0.000 |
0.335 0.228 | 0.400 |
0.000 0.000 | 0.049 |
0.000 0.000 | 0.000 |
| 2 spectra, DGDEDISTEFGHK | 0.000 | 0.000 | 0.417 | 0.279 | 0.000 | 0.252 | 0.052 | 0.000 | ||
| 2 spectra, SVQEDIGHQPLQPTGPGSGESR | 0.000 | 0.020 | 0.192 | 0.267 | 0.000 | 0.521 | 0.000 | 0.000 | ||
| 1 spectrum, LQDQDEWTR | 0.000 | 0.085 | 0.336 | 0.264 | 0.000 | 0.113 | 0.203 | 0.000 |
| Plot | Mito | Lyso or Perox | ER | Golgi | PM | Cytosol | Nucleus | ||||||
| Expt B |
1 peptide |
1 spectrum |
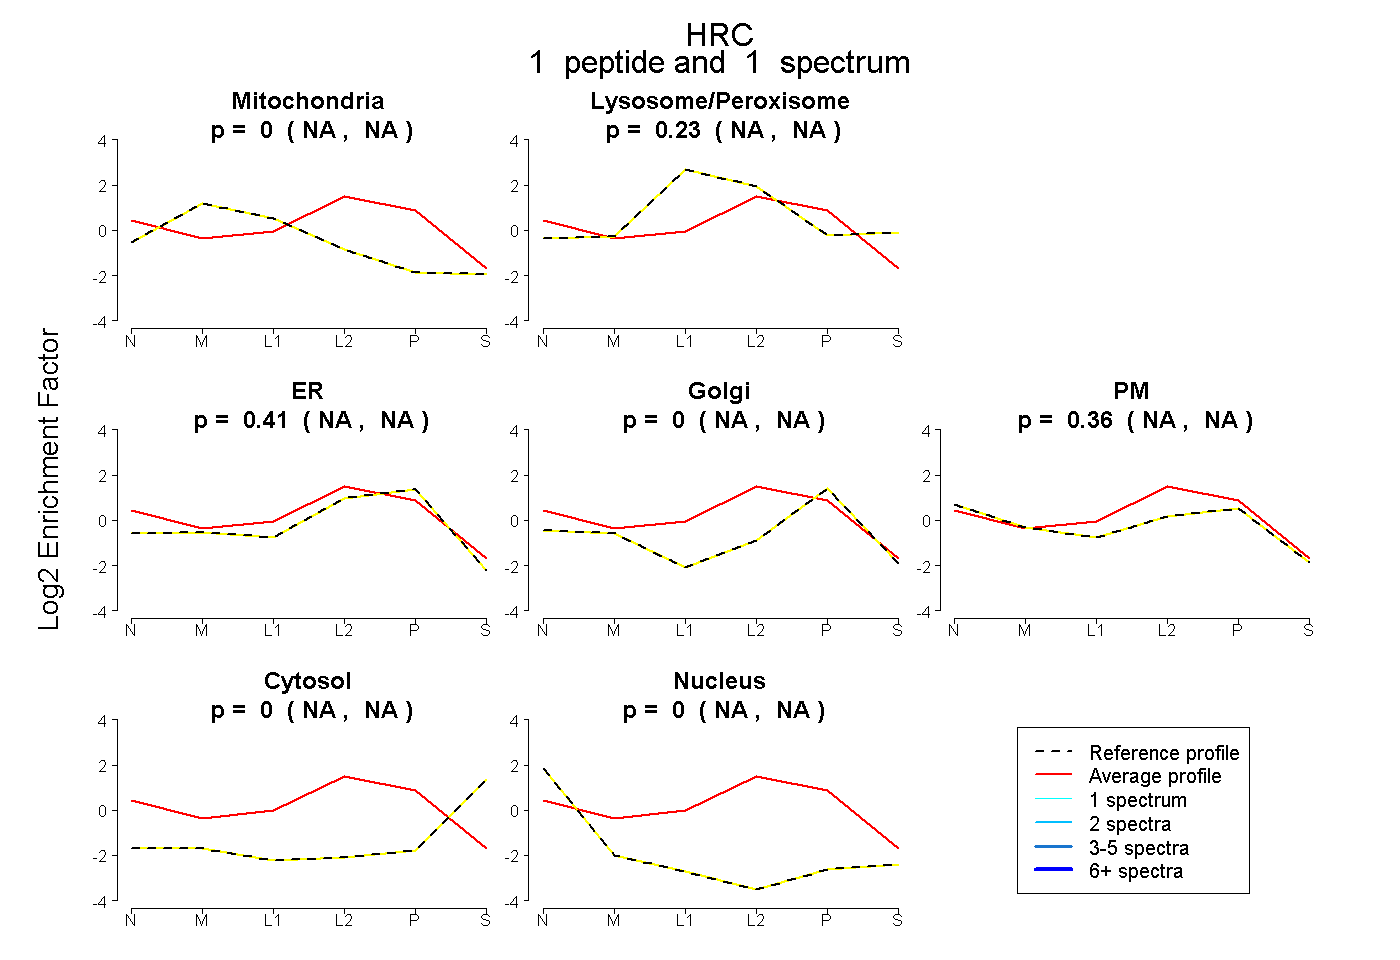 |
0.000 NA | NA |
0.232 NA | NA |
0.408 NA | NA |
0.000 NA | NA |
0.360 NA | NA |
0.000 NA | NA |
0.000 NA | NA |
|||
| Plot | Lyso | Other | |||||||||||
| Expt C |
2 peptides |
5 spectra |
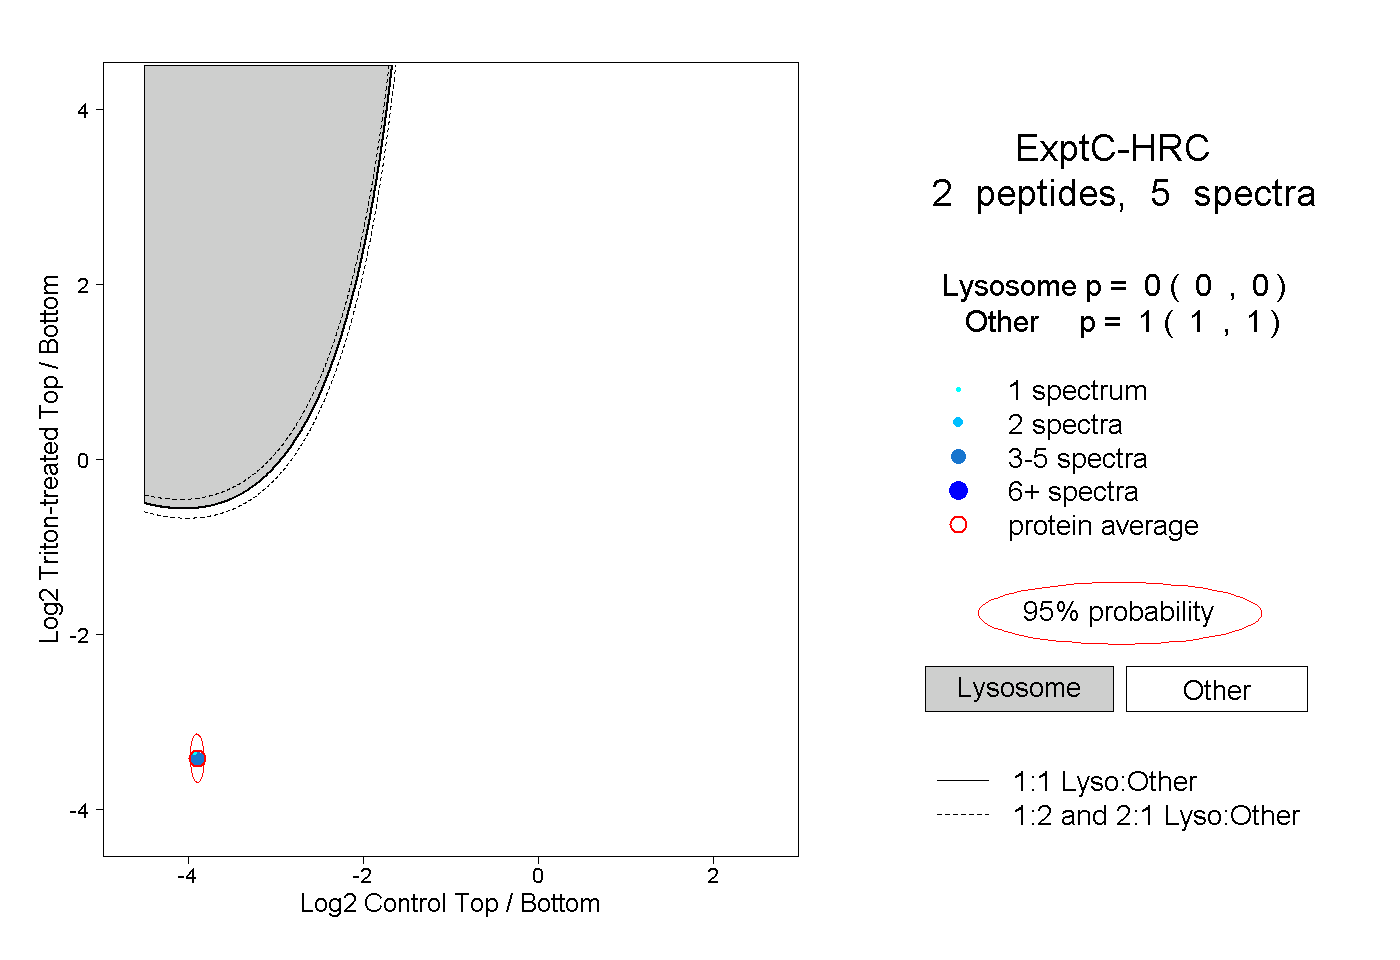 |
0.000 0.000 | 0.000 |
1.000 1.000 | 1.000 |