 6
6peptides
spectra
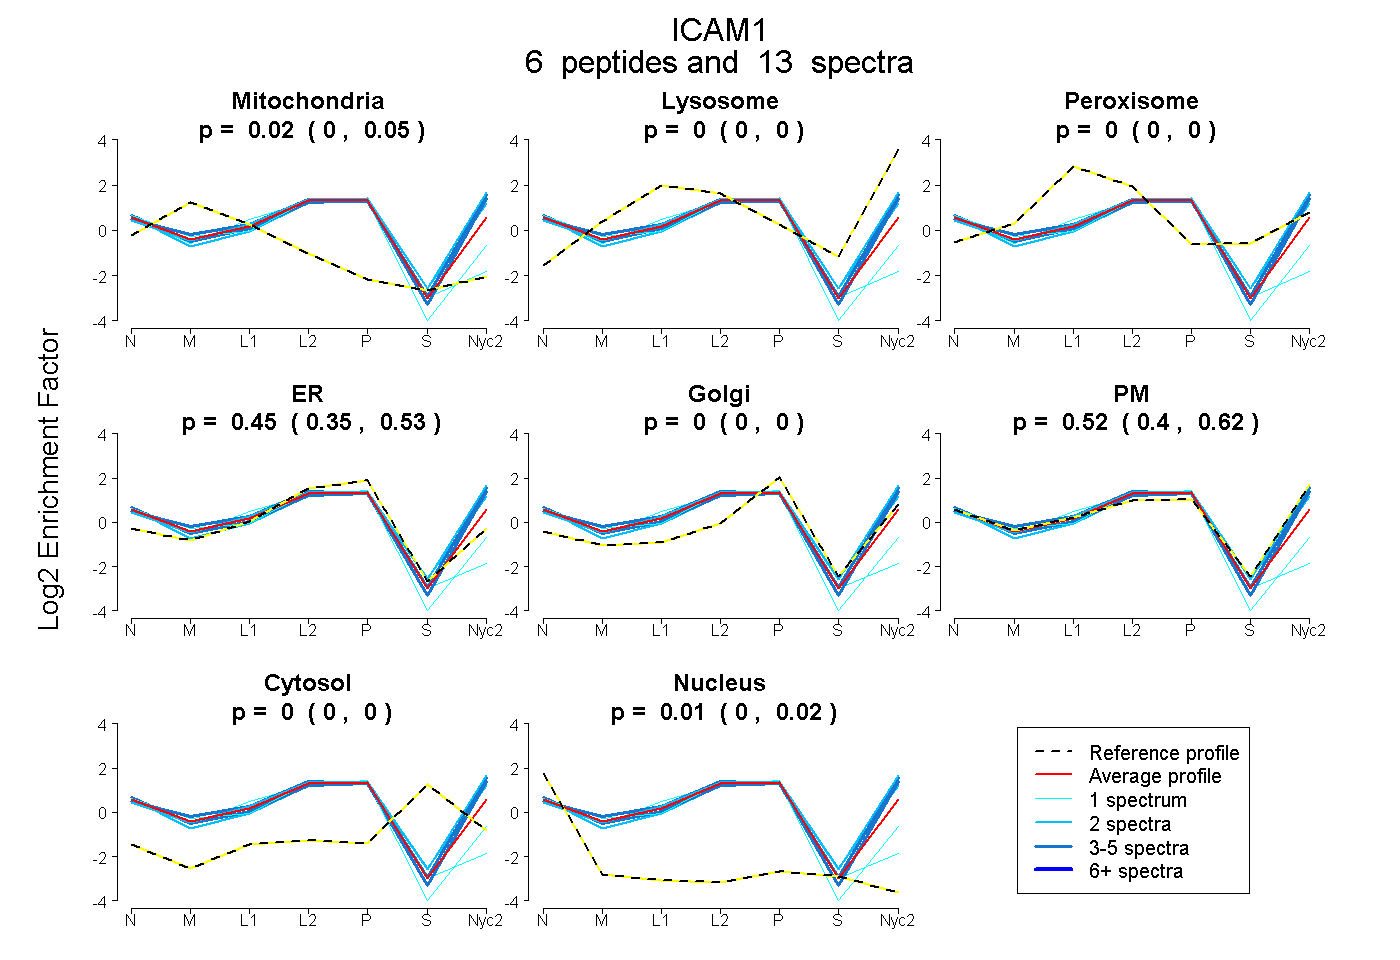
0.001 | 0.046
0.000 | 0.000
0.000 | 0.000
0.354 | 0.529
0.000 | 0.000
0.400 | 0.621
0.000 | 0.000
0.000 | 0.018
3peptides
spectra
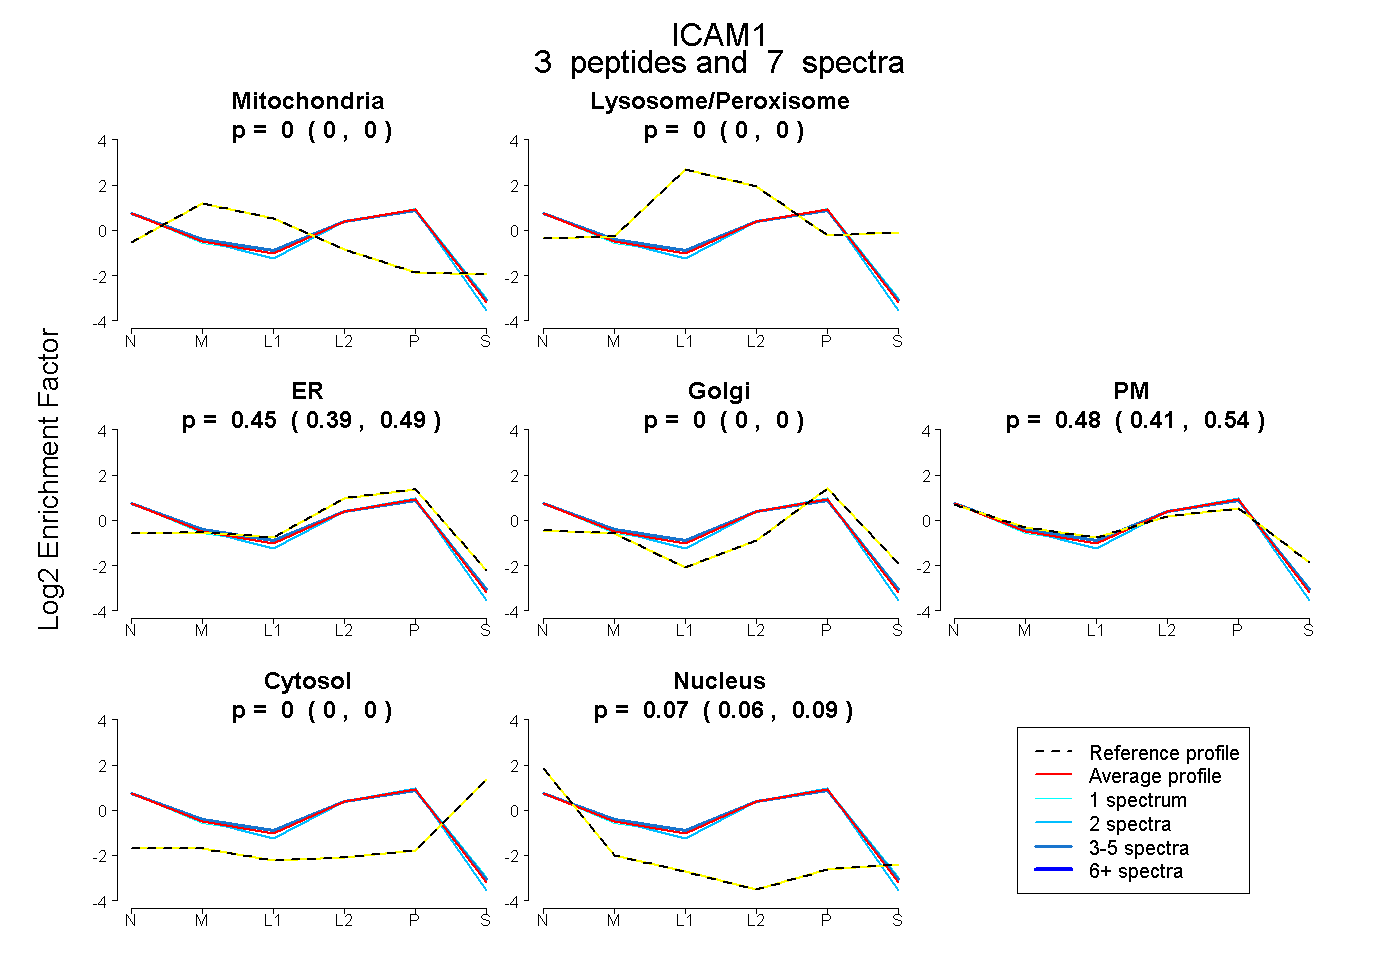
0.000 | 0.000
0.000 | 0.000
0.392 | 0.492
0.000 | 0.000
0.408 | 0.541
0.000 | 0.000
0.055 | 0.089
8peptides
spectra
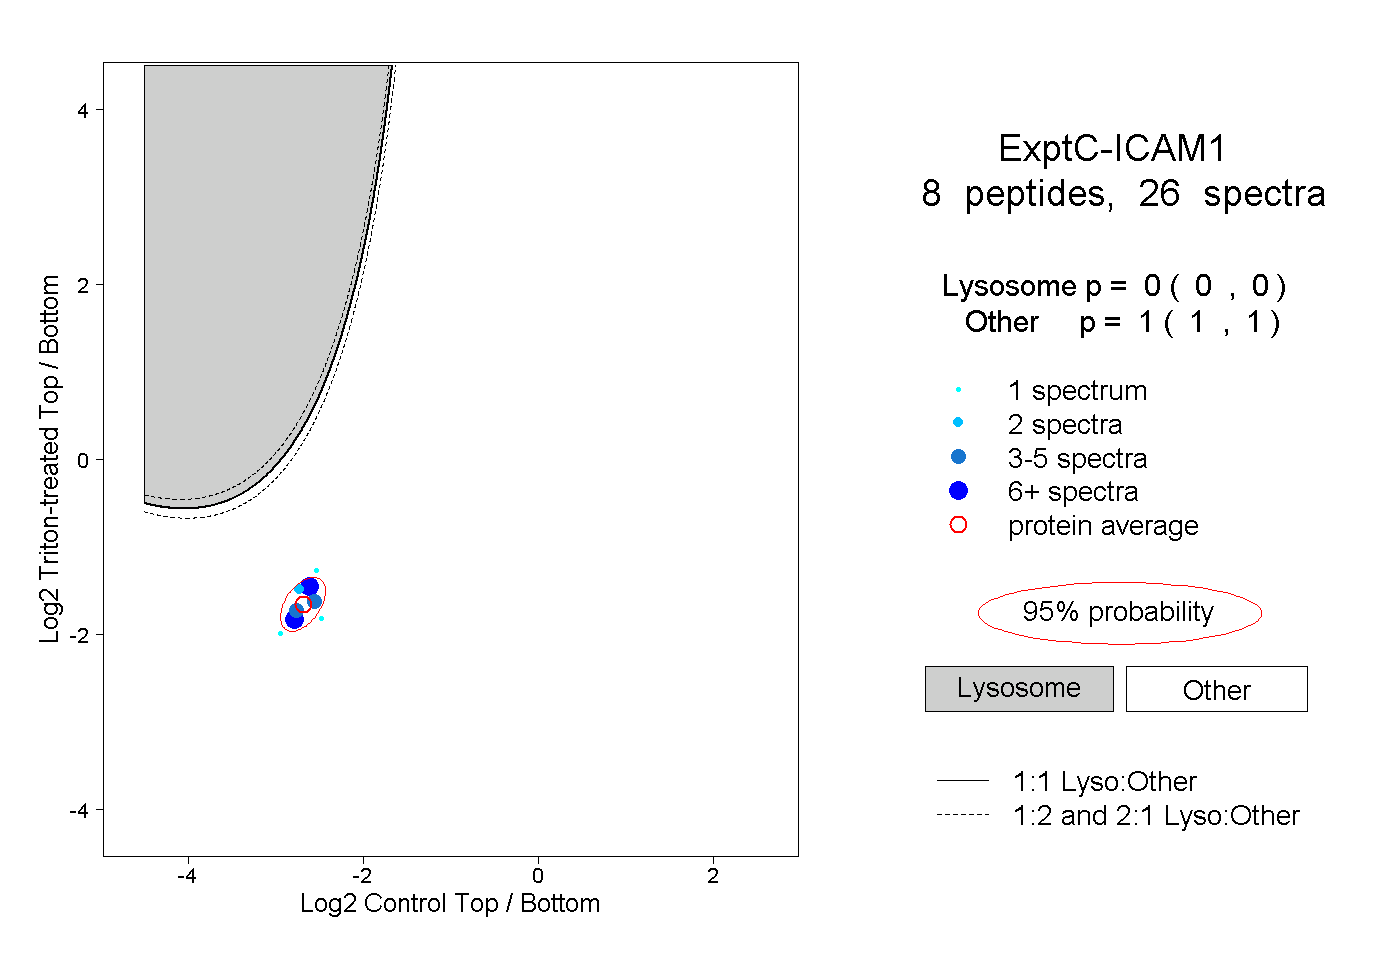
0.000 | 0.000
1.000 | 1.000
4peptides
spectra
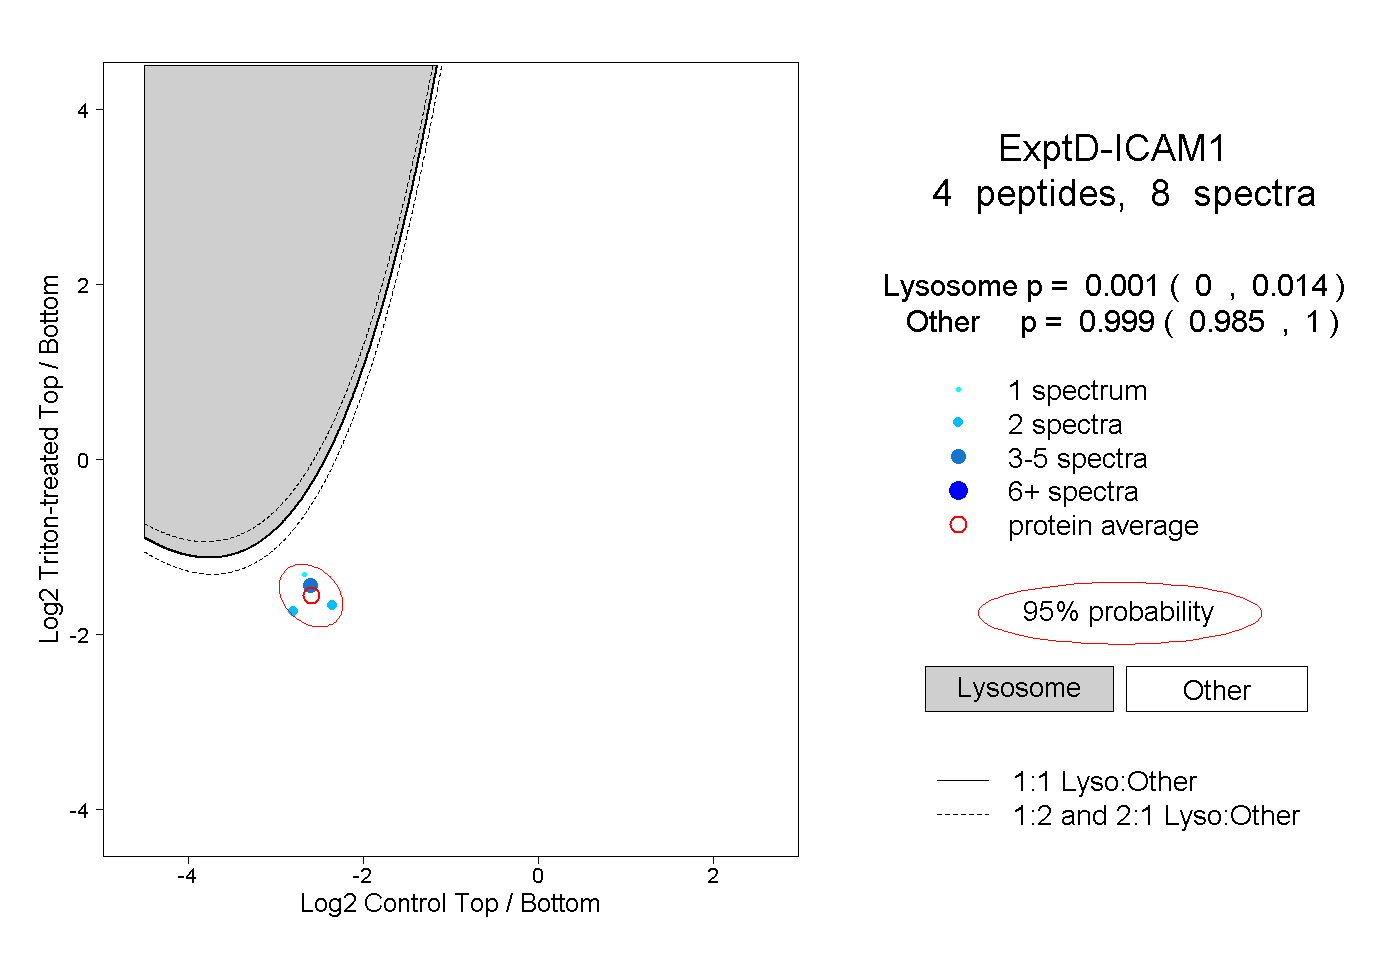
0.000 | 0.014
0.985 | 1.000