 6
6peptides
spectra
0.001 | 0.046
0.000 | 0.000
0.000 | 0.000
0.354 | 0.529
0.000 | 0.000
0.400 | 0.621
0.000 | 0.000
0.000 | 0.018
| Plot | Mito | Lyso | Perox | ER | Golgi | PM | Cytosol | Nucleus | |||||
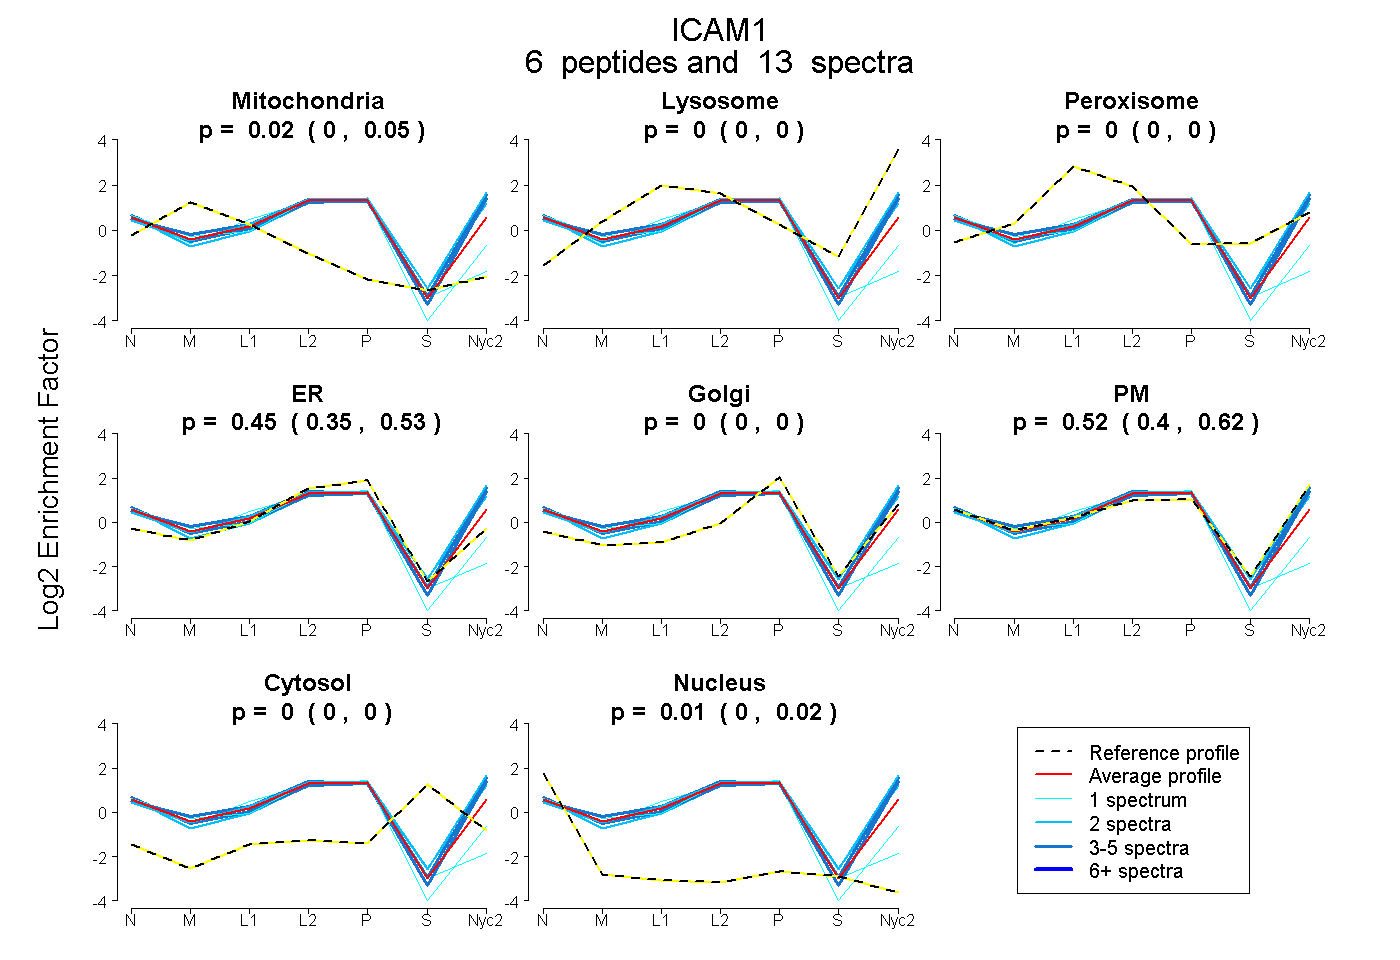
| Expt A |
6 peptides |
13 spectra |
|
0.024 0.001 | 0.046 |
0.000 0.000 | 0.000 |
0.000 0.000 | 0.000 |
0.447 0.354 | 0.529 |
0.000 0.000 | 0.000 |
0.518 0.400 | 0.621 |
0.000 0.000 | 0.000 |
0.010 0.000 | 0.018 |
| 2 spectra, VELDPLPAWQQVGK | 0.000 | 0.035 | 0.000 | 0.136 | 0.000 | 0.829 | 0.000 | 0.000 | ||
| 3 spectra, EITFTVLASR | 0.000 | 0.000 | 0.000 | 0.192 | 0.000 | 0.808 | 0.000 | 0.000 | ||
| 4 spectra, TQLSVVLLR | 0.000 | 0.000 | 0.000 | 0.132 | 0.000 | 0.868 | 0.000 | 0.000 | ||
| 1 spectrum, CLVEGGAPR | 0.133 | 0.000 | 0.000 | 0.805 | 0.000 | 0.000 | 0.000 | 0.062 | ||
| 2 spectra, AQEEALK | 0.000 | 0.000 | 0.000 | 0.254 | 0.013 | 0.724 | 0.000 | 0.009 | ||
| 1 spectrum, FFCSAALEVDGK | 0.103 | 0.000 | 0.000 | 0.801 | 0.000 | 0.054 | 0.000 | 0.043 |
| Plot | Mito | Lyso or Perox | ER | Golgi | PM | Cytosol | Nucleus | ||||||
| Expt B |
3 peptides |
7 spectra |
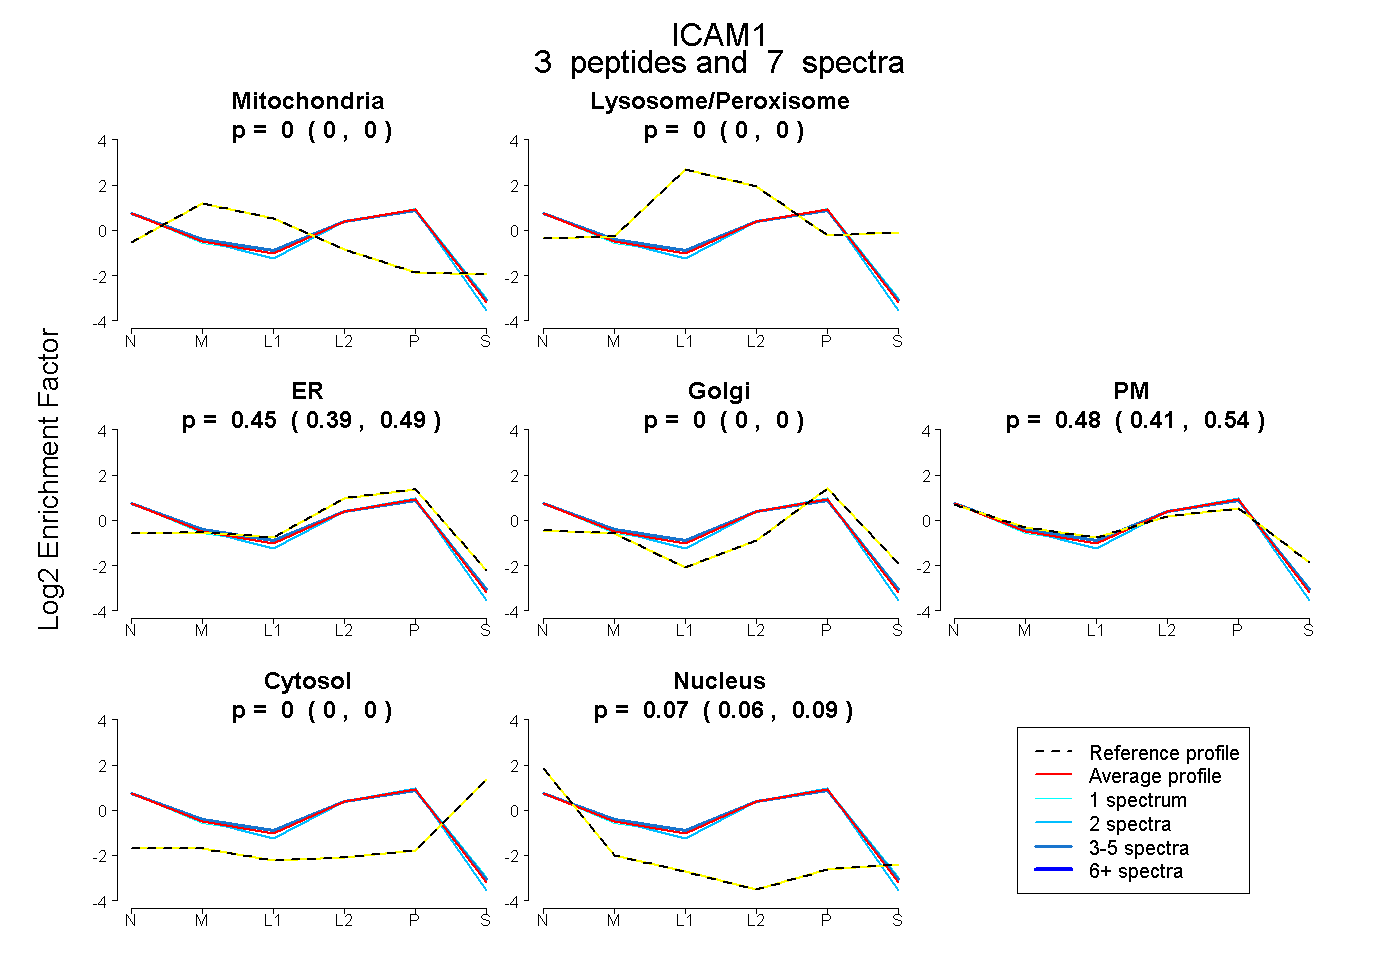 |
0.000 0.000 | 0.000 |
0.000 0.000 | 0.000 |
0.445 0.392 | 0.492 |
0.000 0.000 | 0.000 |
0.481 0.408 | 0.541 |
0.000 0.000 | 0.000 |
0.073 0.055 | 0.089 |
|||
| Plot | Lyso | Other | |||||||||||
| Expt C |
8 peptides |
26 spectra |
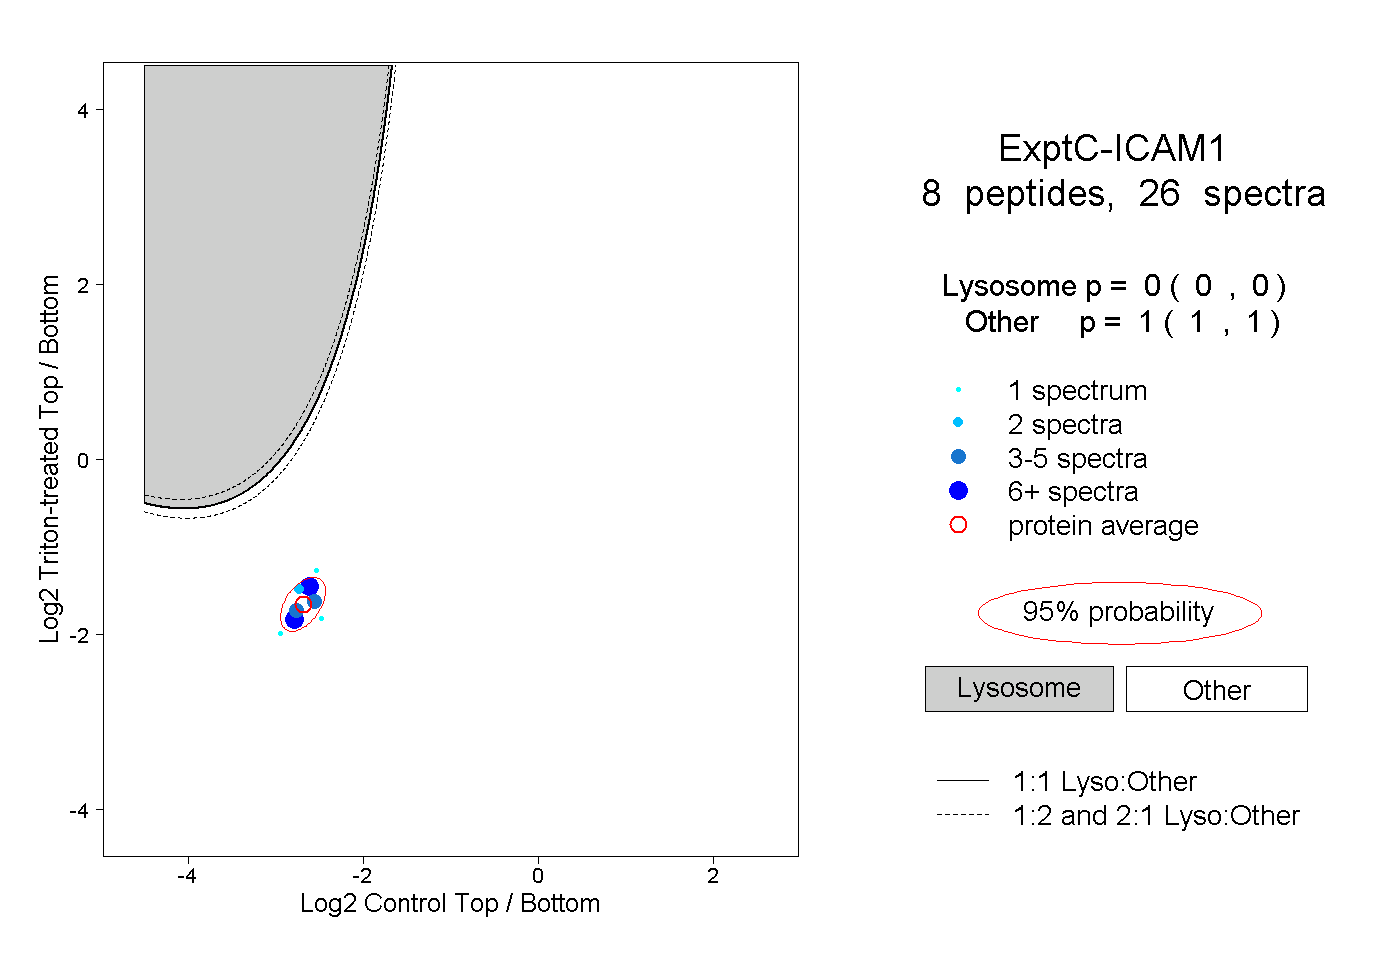 |
0.000 0.000 | 0.000 |
1.000 1.000 | 1.000 |
||||||||
| Plot | Lyso | Other | |||||||||||
| Expt D |
4 peptides |
8 spectra |
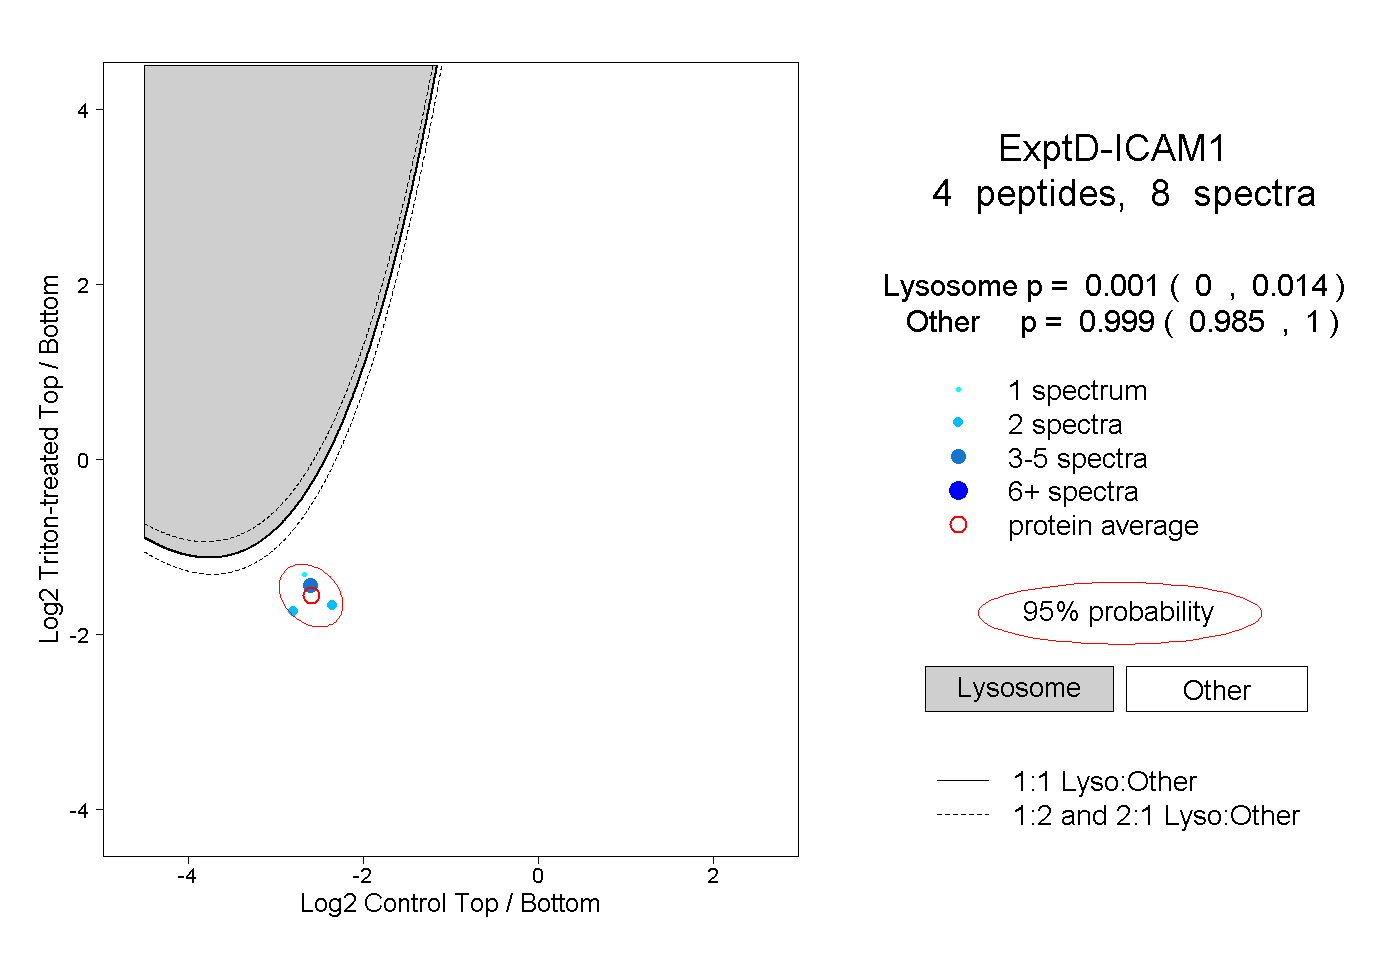 |
0.001 0.000 | 0.014 |
0.999 0.985 | 1.000 |