 6
6peptides
spectra
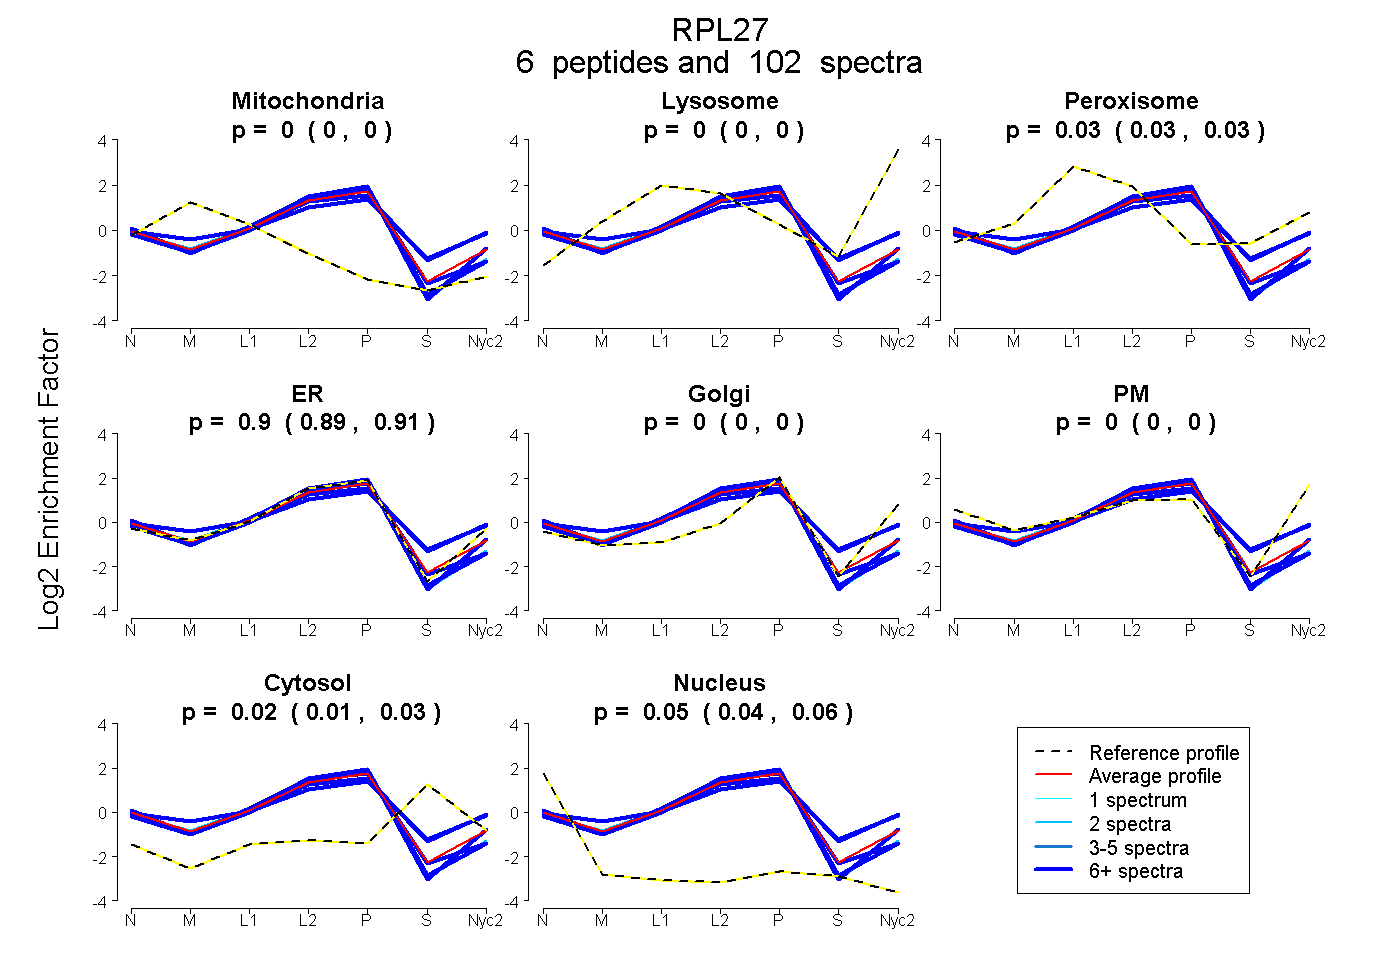
0.000 | 0.000
0.000 | 0.000
0.026 | 0.034
0.892 | 0.906
0.000 | 0.000
0.000 | 0.000
0.008 | 0.029
0.043 | 0.056
4peptides
spectra
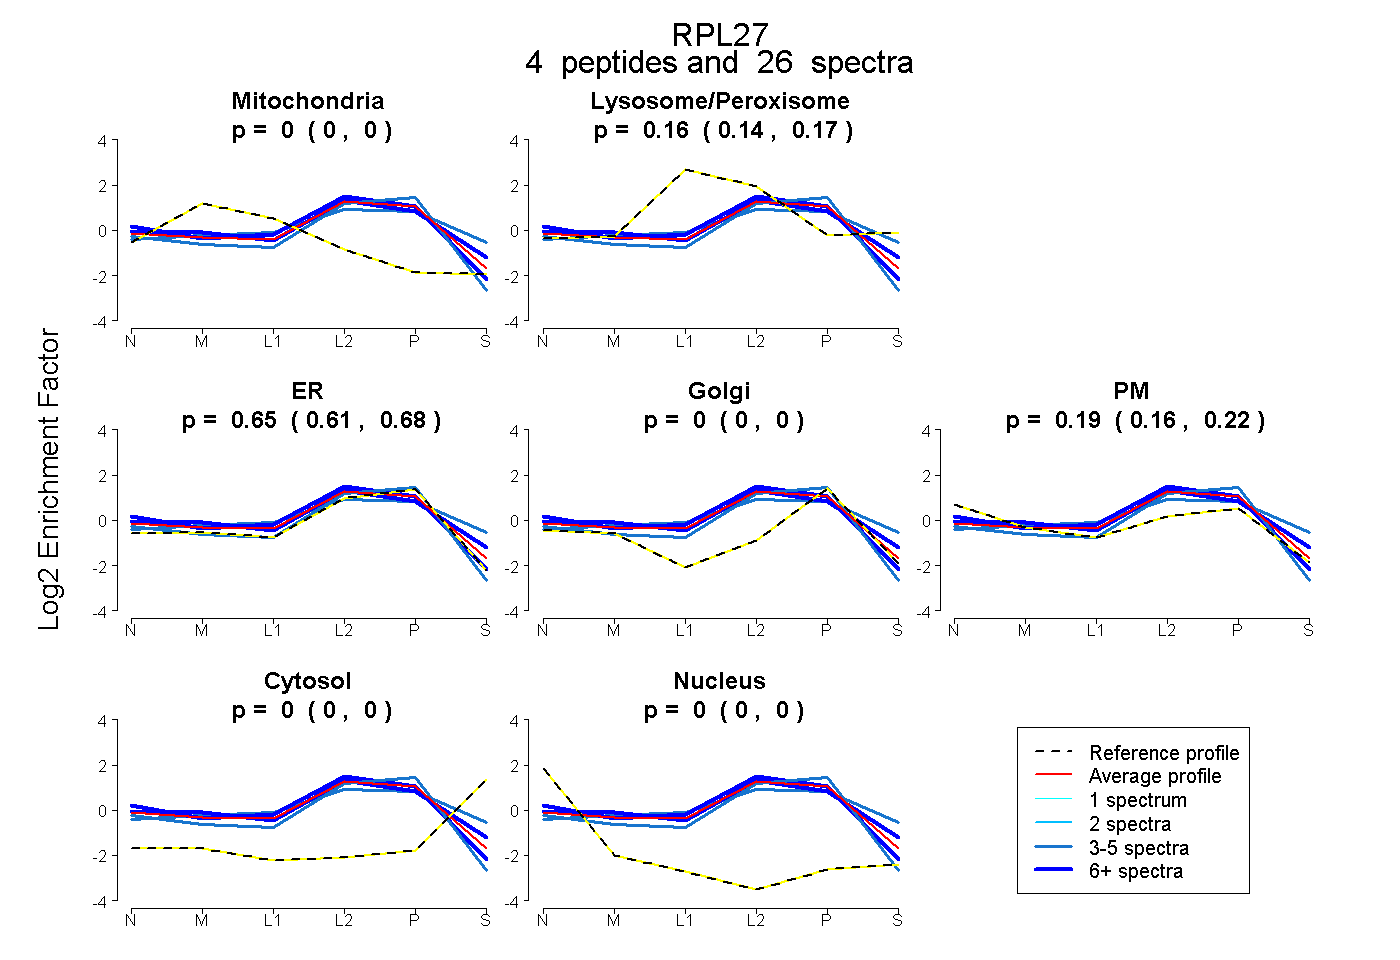
0.000 | 0.000
0.136 | 0.173
0.609 | 0.683
0.000 | 0.000
0.164 | 0.219
0.000 | 0.000
0.000 | 0.000
5peptides
spectra
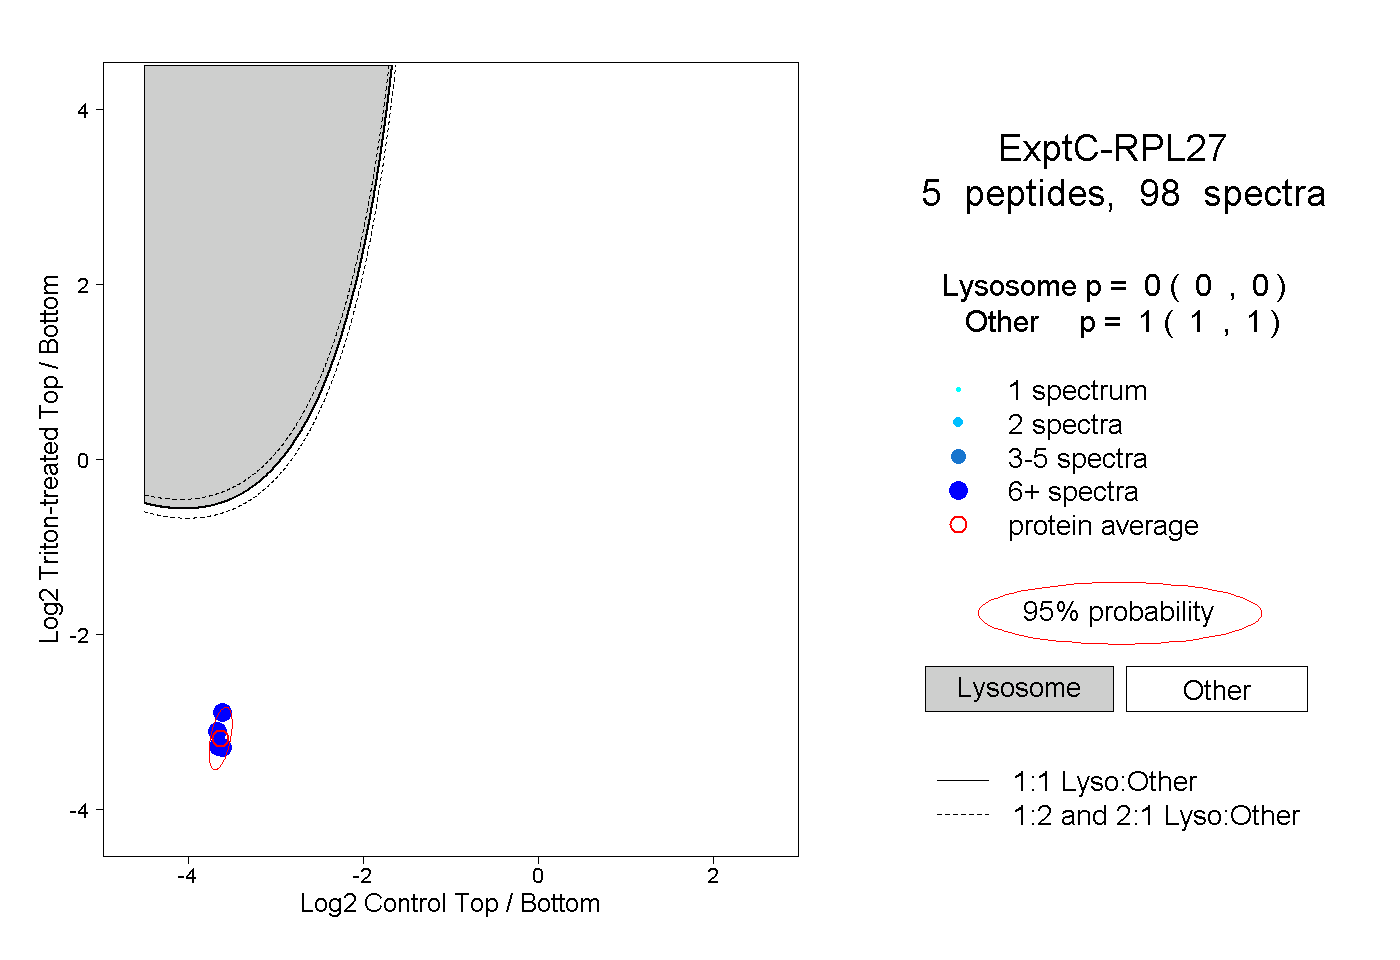
0.000 | 0.000
1.000 | 1.000
1peptide
spectrum
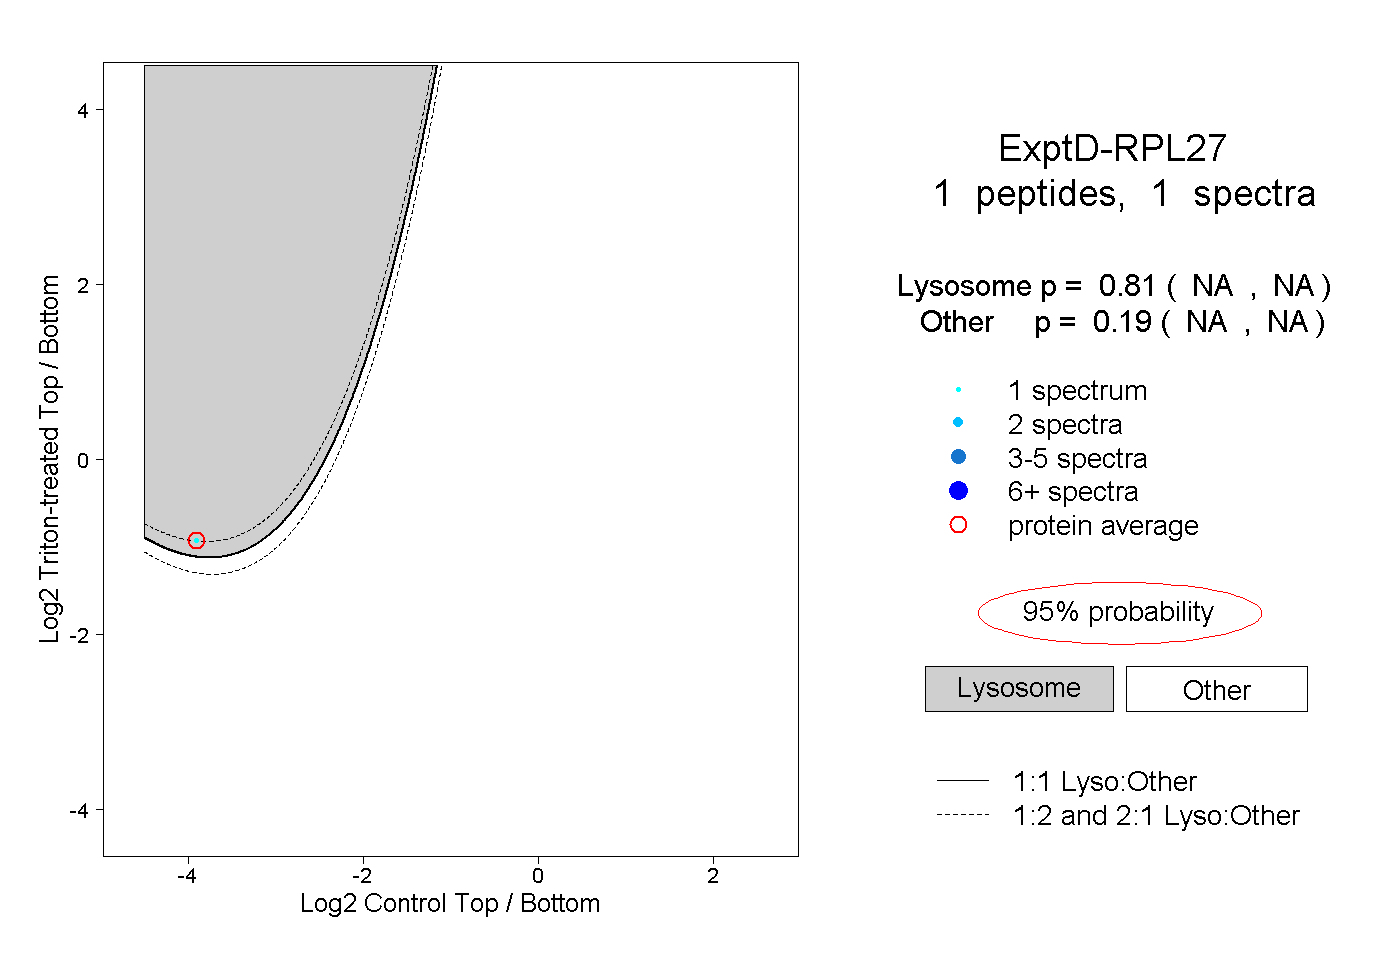
NA | NA
NA | NA