 6
6peptides
spectra
0.000 | 0.000
0.000 | 0.000
0.026 | 0.034
0.892 | 0.906
0.000 | 0.000
0.000 | 0.000
0.008 | 0.029
0.043 | 0.056
| Plot | Mito | Lyso | Perox | ER | Golgi | PM | Cytosol | Nucleus | |||||
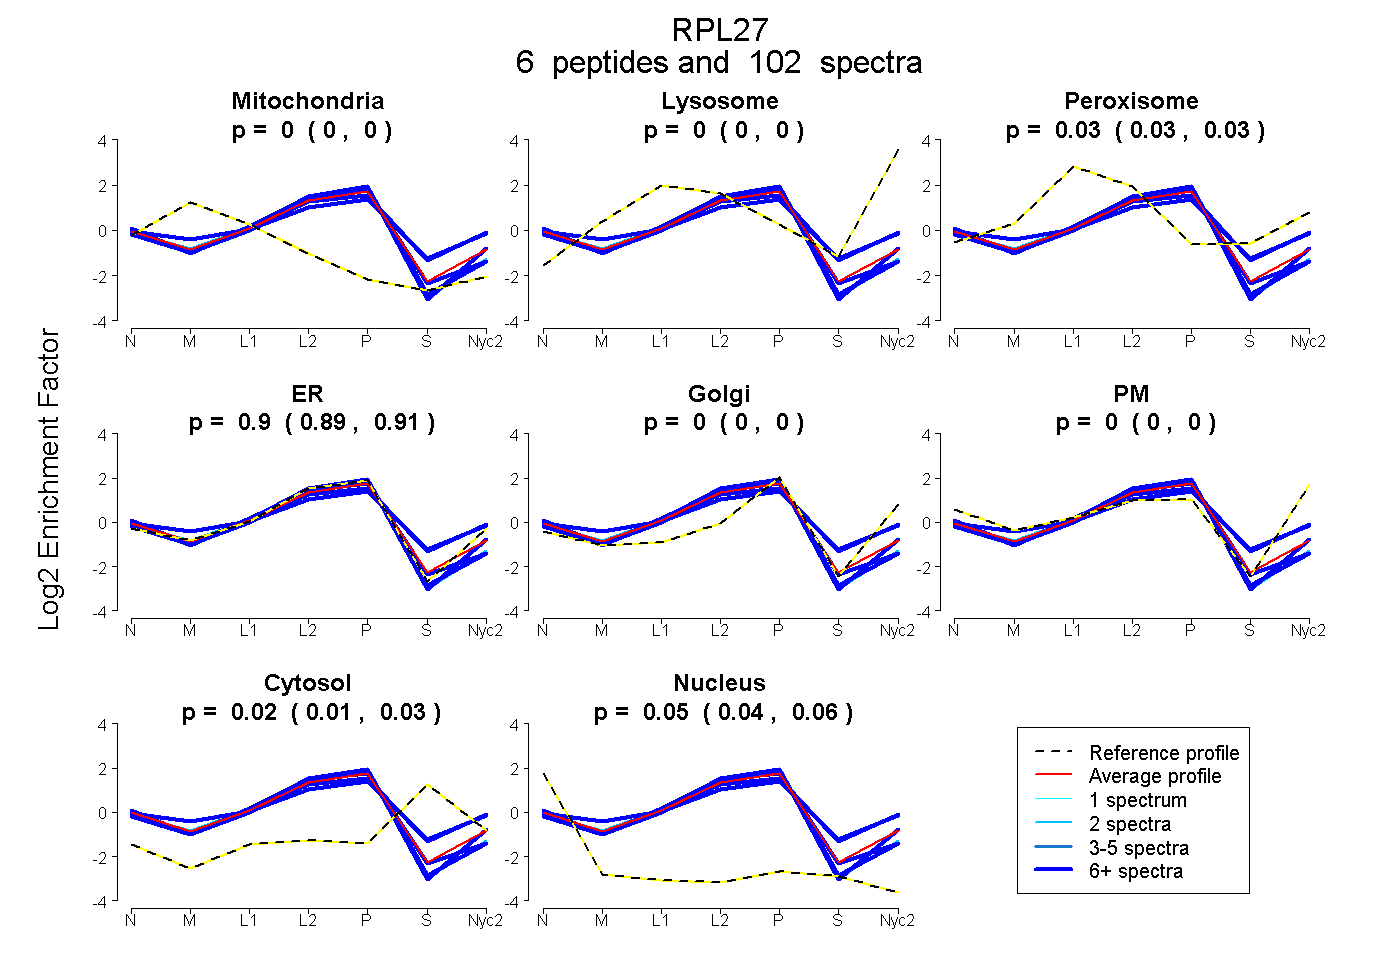
| Expt A |
6 peptides |
102 spectra |
|
0.000 0.000 | 0.000 |
0.000 0.000 | 0.000 |
0.030 0.026 | 0.034 |
0.900 0.892 | 0.906 |
0.000 0.000 | 0.000 |
0.000 0.000 | 0.000 |
0.020 0.008 | 0.029 |
0.050 0.043 | 0.056 |
| 2 spectra, DPALK | 0.004 | 0.000 | 0.000 | 0.955 | 0.000 | 0.000 | 0.000 | 0.041 | ||
| 27 spectra, VVLVLAGR | 0.000 | 0.000 | 0.000 | 0.934 | 0.000 | 0.000 | 0.000 | 0.066 | ||
| 51 spectra, VYNYSHLMPTR | 0.000 | 0.000 | 0.161 | 0.555 | 0.105 | 0.041 | 0.138 | 0.000 | ||
| 7 spectra, VTAAMGK | 0.000 | 0.000 | 0.000 | 0.955 | 0.000 | 0.000 | 0.000 | 0.045 | ||
| 6 spectra, NIDDGTSDRPYSHALVAGIDR | 0.000 | 0.000 | 0.079 | 0.679 | 0.000 | 0.089 | 0.153 | 0.000 | ||
| 9 spectra, YSVDIPLDK | 0.000 | 0.000 | 0.010 | 0.911 | 0.000 | 0.000 | 0.000 | 0.078 |
| Plot | Mito | Lyso or Perox | ER | Golgi | PM | Cytosol | Nucleus | ||||||
| Expt B |
4 peptides |
26 spectra |
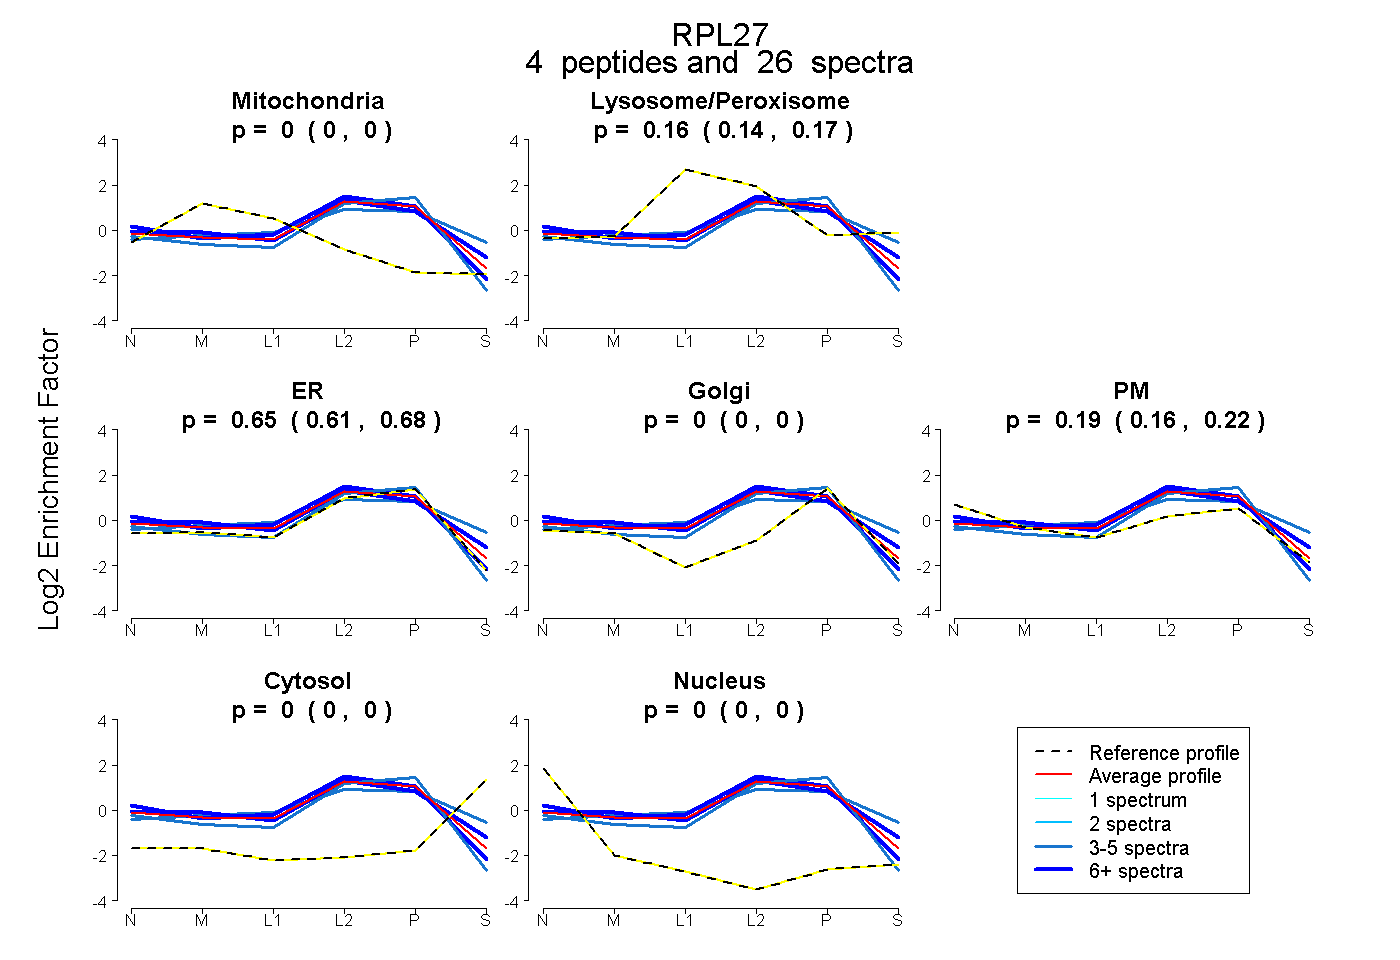 |
0.000 0.000 | 0.000 |
0.156 0.136 | 0.173 |
0.651 0.609 | 0.683 |
0.000 0.000 | 0.000 |
0.194 0.164 | 0.219 |
0.000 0.000 | 0.000 |
0.000 0.000 | 0.000 |
|||
| Plot | Lyso | Other | |||||||||||
| Expt C |
5 peptides |
98 spectra |
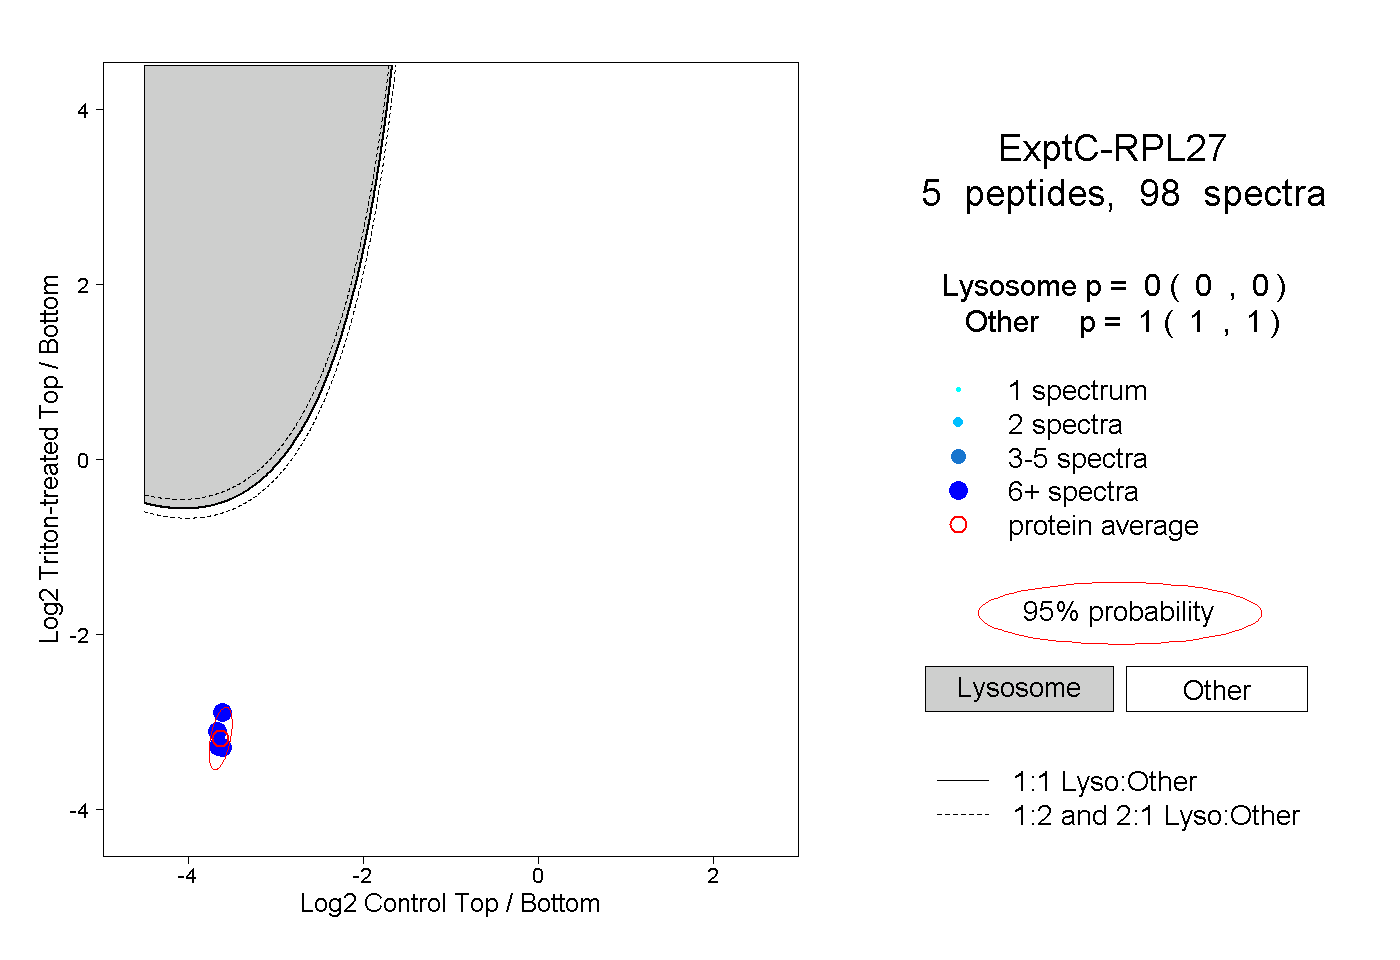 |
0.000 0.000 | 0.000 |
1.000 1.000 | 1.000 |
||||||||
| Plot | Lyso | Other | |||||||||||
| Expt D |
1 peptide |
1 spectrum |
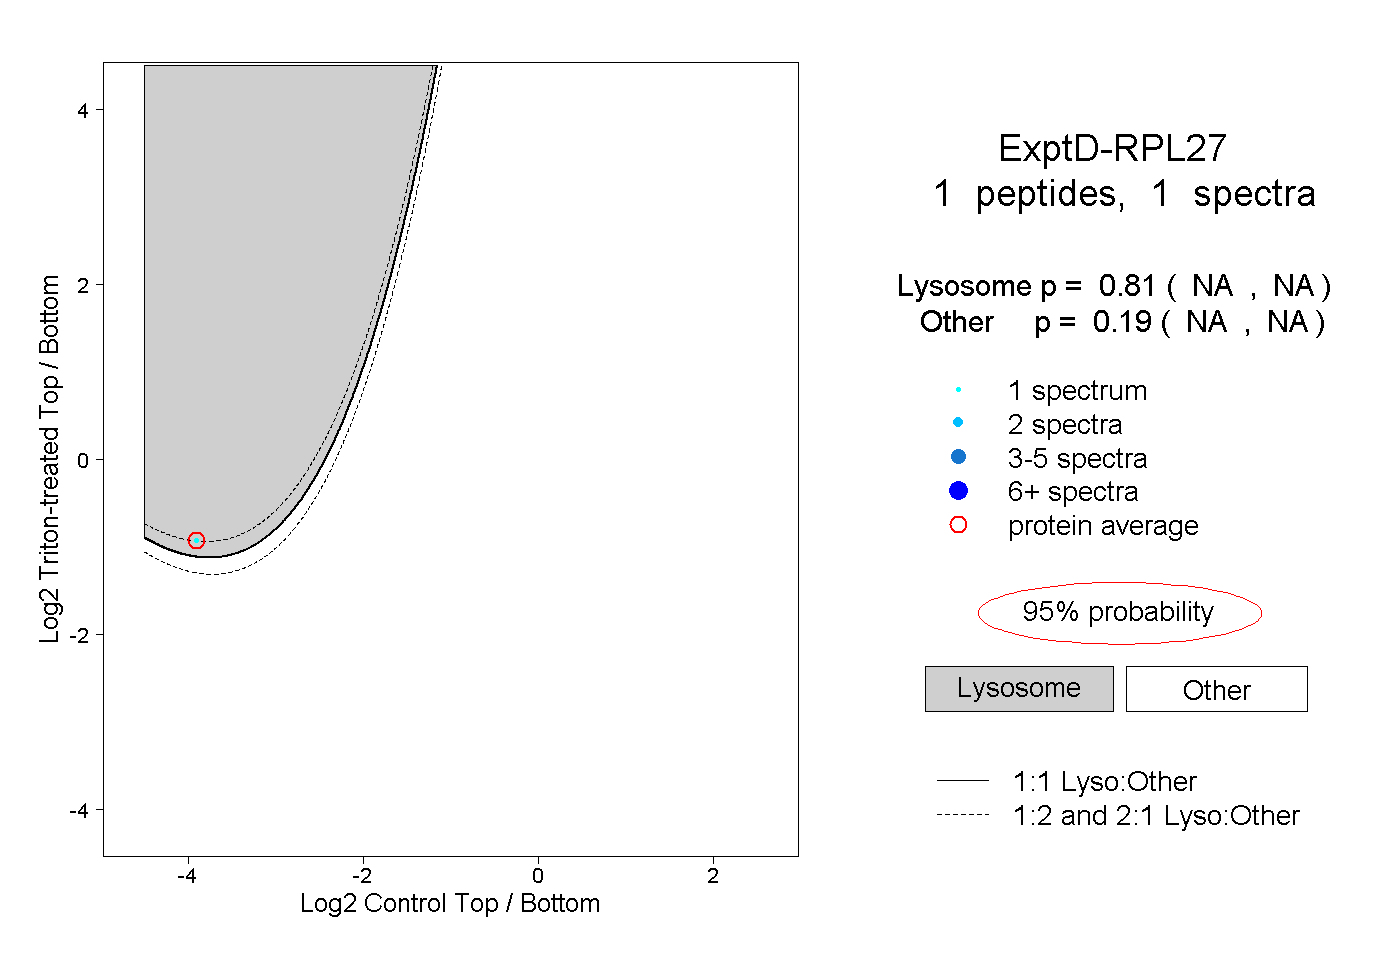 |
0.810 NA | NA |
0.190 NA | NA |